Categories: Technical analysis

Home Depot Wave Analysis 23 October, 2020

• Home Depot falling inside impulse wave (i)

• Likely to reach 275,00

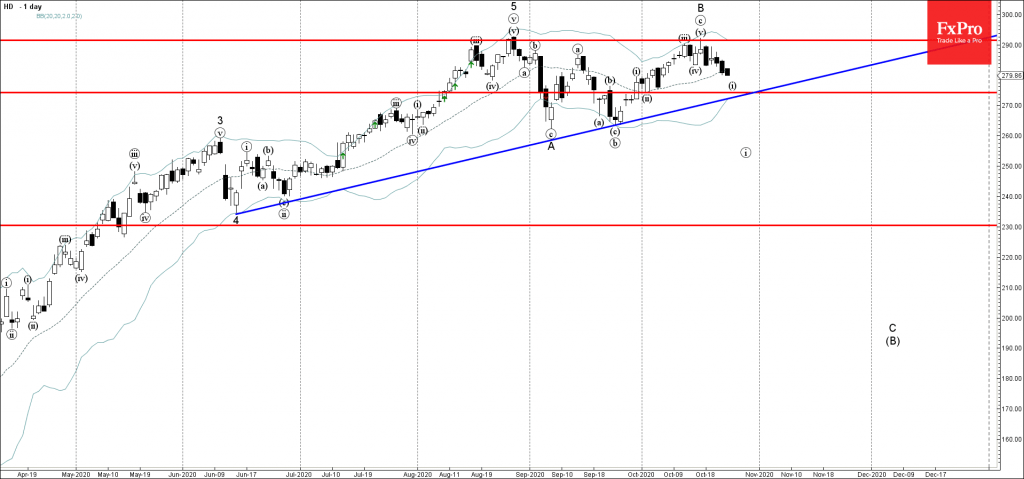
Home Depot continues to fall inside the short-term impulse wave (i) which started earlier from the strong resistance level 291,00 (which stopped the earlier sharp uptrend at the end of August).

The active impulse wave (i) belongs to the downward impulse sequence C of the larger ABC correction (B) from August.

Home Depot is likely to fall further toward the next support level 275,00 (low of the previous minor correction (ii) from the start of October).

The FxPro Tech Analysis Team

The FxPro technical experts prepare a daily analysis of the most active currency pairs (majors, crosses, exotics) and commodities. Selected instruments are reviewed on daily trends (D1, H4), using the active Elliott Wave setups, Japanese candlesticks, indicators, and support/resistance levels.

Share
Published by
The FxPro Tech Analysis Team
Tags: HD

Recent Posts

Brent Crude oil Wave Analysis – 13 January 2026

Brent Crude oil ⬆️ Buy - Brent Crude oil rising inside impulse wave c -…

21 minutes ago

USDJPY Wave Analysis – 13 January 2026

USDJPY ⬆️ Buy - USDJPY broke resistance area - Likely to rise to resistance level…

22 minutes ago

Exxon Mobil Wave Analysis – 13 January 2026

Exxon Mobil ⬆️ Buy - Exxon Mobil broke resistance level 125.60 - Likely to rise…

23 minutes ago

BNB Wave Analysis – 13 January 2026

Brent Crude oil ⬆️ Buy - BNB broke out of sideways price range - Likely…

23 minutes ago

A slightly weaker CPI was not enough to break through the highs

US CPI data a bit softer than forecasts, sparking brief market optimism, but resistance remains.…

6 hours ago

Pro News Flash: Global Tensions Fuel a Fresh Oil Rally

🛢️ Oil prices are finding fresh strength as geopolitical tensions in the Middle East reignite…

6 hours ago

This website uses cookies