Categories: Technical analysis

Harley-Davidson Wave Analysis – 12 March 2025

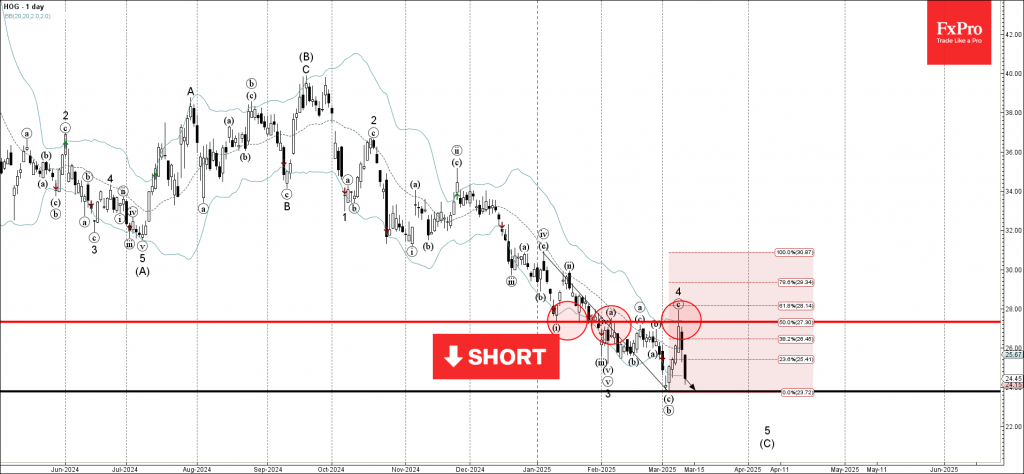
Harley-Davidson: ⬇️ Sell

– Harley-Davidson reversed from resistance level 27.35

– Likely to fall to support level 23.80

Harley-Davidson recently reversed from the resistance area between the key resistance level 27.35 (former double bottom from January), upper daily Bollinger Band and the 50% Fibonacci correction of the downward impulse from January.

The downward reversal from this resistance area stopped the earlier short-term ABC correction 4 from the start of February.

Given the overriding daily downtrend, Harley-Davidson can be expected to fall to the next support level 23.80.

The FxPro Tech Analysis Team

The FxPro technical experts prepare a daily analysis of the most active currency pairs (majors, crosses, exotics) and commodities. Selected instruments are reviewed on daily trends (D1, H4), using the active Elliott Wave setups, Japanese candlesticks, indicators, and support/resistance levels.

Share
Published by
The FxPro Tech Analysis Team

Recent Posts

Pro News Weekly: Dollar Rebounds as Markets Test New Limits

Welcome to Pro News Weekly! Here’s what is shaping the markets: 💵 The U.S. dollar…

4 hours ago

Geopolitics will destroy the euro

•    EURUSD falls due to geopolitics and expectations of tariff removal •    Gold returns to…

11 hours ago

Platinum Wave Analysis – 8 January 2026

Platinum: ⬇️ Sell - Platinum reversed from pivotal resistance level 150.00 - Likely to fall to…

1 day ago

Baidu Wave Analysis – 8 January 2026

Baidu: ⬇️ Sell - Baidu reversed from resistance zone - Likely to fall to support level…

1 day ago

EURUSD Wave Analysis – 8 January 2026

EURUSD: ⬇️ Sell - EURUSD broke daily up channel - Likely to fall to support…

1 day ago

WTI crude oil Wave Analysis – 8 January 2026

WTI crude oil: ⬆️ Buy - WTI crude oil reversed from support zone - Likely…

1 day ago

This website uses cookies