Categories: Technical analysis

Halliburton Wave Analysis 9 December, 2020

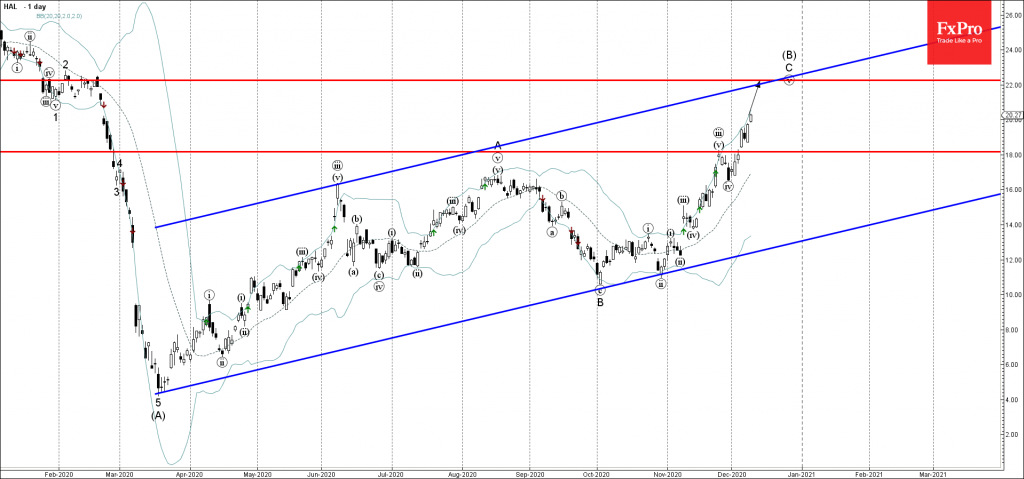
• Halliburton rising inside accelerated impulse wave C

• Likely to reach resistance level 22.00

Halliburton continues to rise inside the accelerated upward impulse wave C – which belongs to the medium-term upward wave (B) from March.

The price earlier broke the key resistance level 18.00 – which strengthened the bullish pressure on Halliburton. 

Given the clear multi-month uptrend Halliburton is expected to rise further toward the next resistance level 22.00 (target price for the completion of the active impulse wave C, intersecting with the weekly up channel from March).

The FxPro Tech Analysis Team

The FxPro technical experts prepare a daily analysis of the most active currency pairs (majors, crosses, exotics) and commodities. Selected instruments are reviewed on daily trends (D1, H4), using the active Elliott Wave setups, Japanese candlesticks, indicators, and support/resistance levels.

Share
Published by
The FxPro Tech Analysis Team

Recent Posts

The dollar does not tolerate dissent

US GDP growth is driven not by the White House, but by AI. The Bank…

5 hours ago

The crypto market has made a breakthrough

The crypto market surges, hitting new highs, with bullish sentiment for Bitcoin and Ethereum amid…

6 hours ago

Brent Crude oil Wave Analysis – 13 January 2026

Brent Crude oil ⬆️ Buy - Brent Crude oil rising inside impulse wave c -…

19 hours ago

USDJPY Wave Analysis – 13 January 2026

USDJPY ⬆️ Buy - USDJPY broke resistance area - Likely to rise to resistance level…

19 hours ago

Exxon Mobil Wave Analysis – 13 January 2026

Exxon Mobil ⬆️ Buy - Exxon Mobil broke resistance level 125.60 - Likely to rise…

19 hours ago

BNB Wave Analysis – 13 January 2026

Brent Crude oil ⬆️ Buy - BNB broke out of sideways price range - Likely…

19 hours ago

This website uses cookies