Categories: Technical analysis

GS Wave Analysis – 13 March, 2020

  • GS stopped near support level 150.00
  • Likely to rise to 160.00

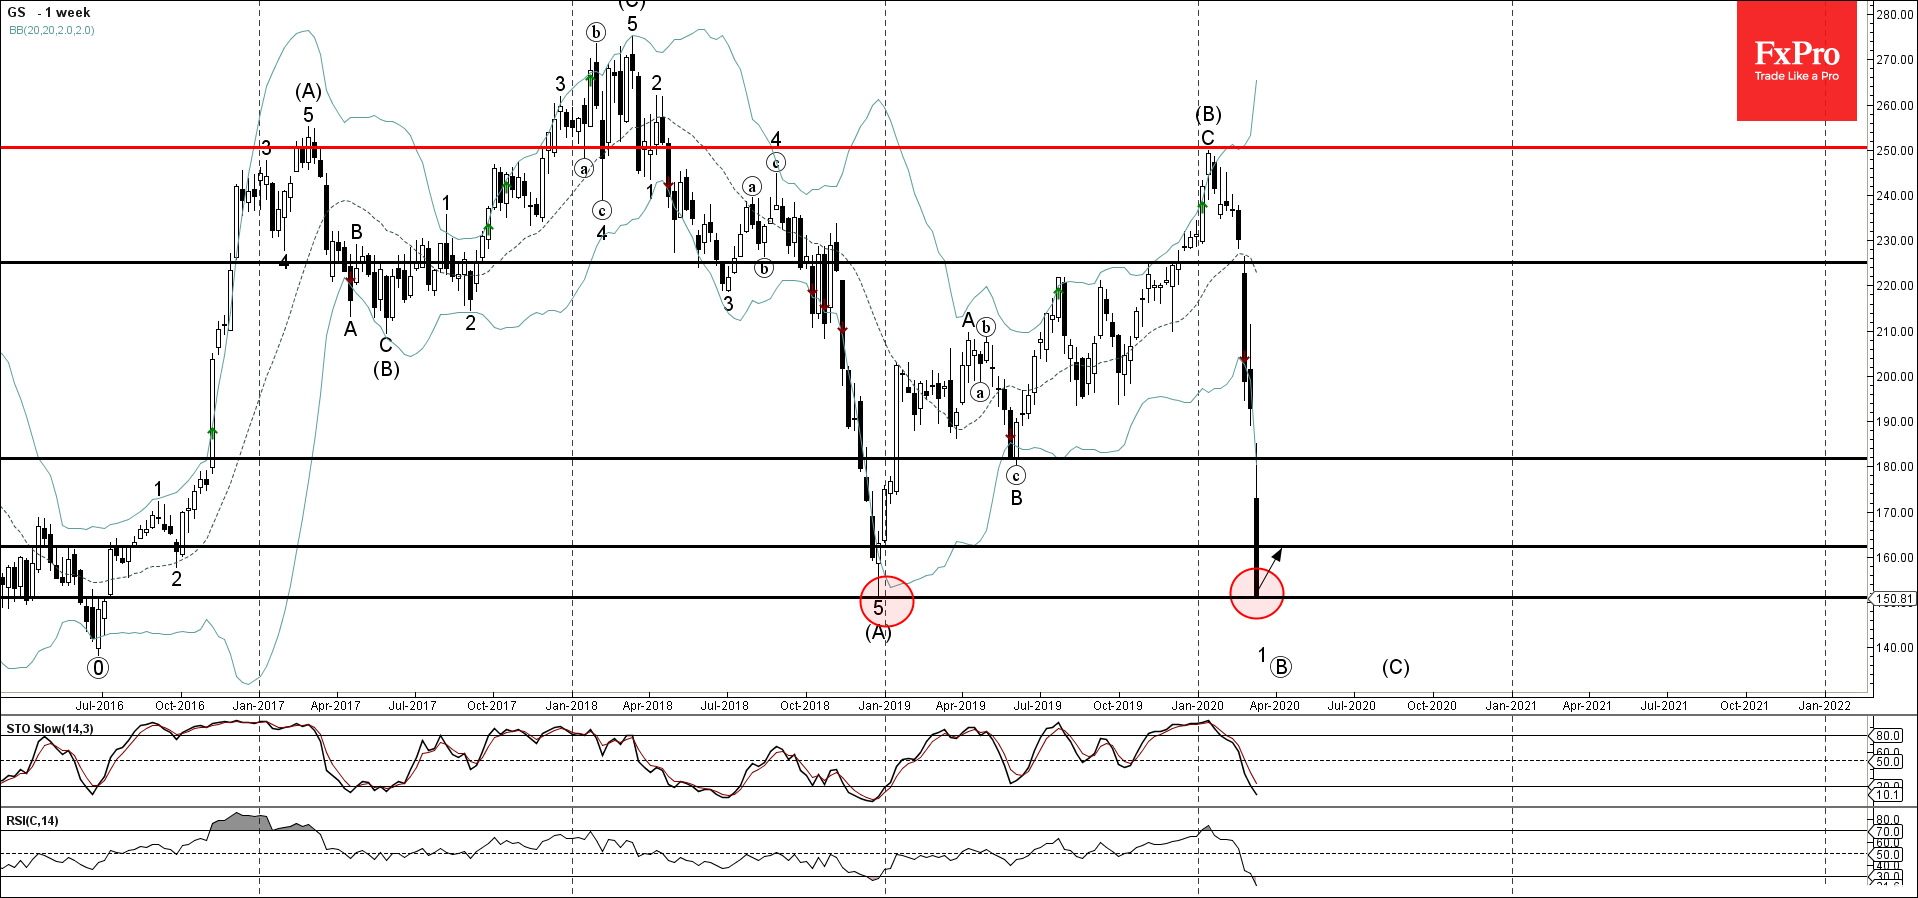
GS recently stopped near the powerful support level 150.00 (which similarly stopped the sharp multi-month downward impulse sequence (A) at the end of 2018, as can be seen below).

The last close stands well below the lower weekly Bollinger Band – which heightens the probability of the upward reversal in the nearest time.


With the weekly Stochastic and RSI indicators both in the oversold territory – GS is likely to rise toward the next resistance level 160.00.

The FxPro Tech Analysis Team

The FxPro technical experts prepare a daily analysis of the most active currency pairs (majors, crosses, exotics) and commodities. Selected instruments are reviewed on daily trends (D1, H4), using the active Elliott Wave setups, Japanese candlesticks, indicators, and support/resistance levels.

Share
Published by
The FxPro Tech Analysis Team
Tags: GS

Recent Posts

USDJPY Wave Analysis 26 April 2024

- USDJPY broke key resistance level 155.00 - Likely to rise to resistance level 160.00…

17 hours ago

Ebay Wave Analysis 26 April 2024

- Ebay reversed from support level 49.35 - Likely to rise to resistance level 52.55…

17 hours ago

False Alert with Yen Interventions?

Even though the Bank of Japan left the key rate and parameters of the QE…

1 day ago

Cooler Bitcoin

Market picture  Market Dynamics: The cryptocurrency market stabilised, losing just 0.1% of capitalisation and dropping to…

1 day ago

GBPCAD Wave Analysis 25 April 2024

- GBPCAD reversed from key support level 1.6910 - Likely to rise to resistance level…

2 days ago

GBPAUD Wave Analysis 25 April 2024

- GBPAUD reversed from support level 1.9135 - Likely to rise to resistance level 1.9360…

2 days ago

This website uses cookies