Categories: Technical analysis

Google Wave Analysis 5 March, 2021

• Google reversed from combined support area

• Likely to rise to resistance 2150.00

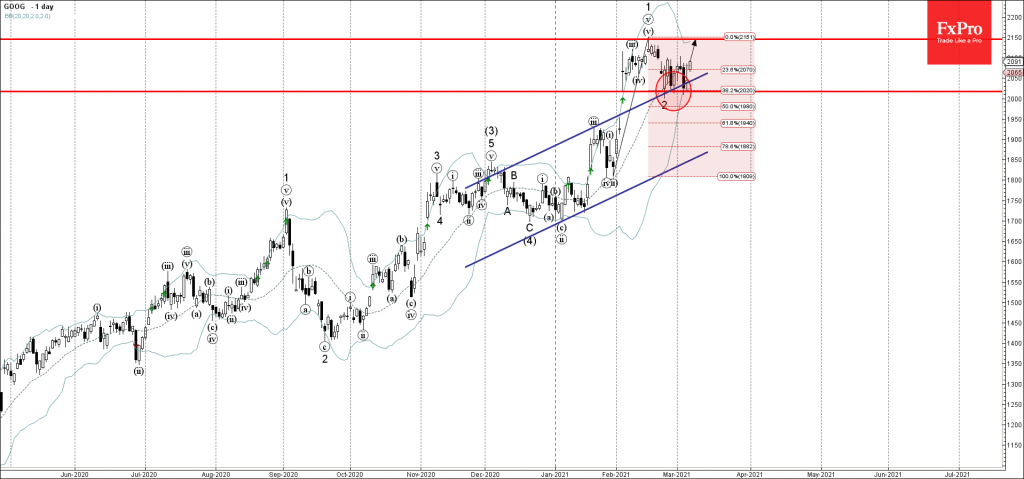
Google recently reversed up from the combined support area located between the support level 2020.0 (which has been revising the price from the end of February) and the upper trendline of the daily up channel from November.

This support area was further strengthened by the 38.2 % Fibonacci correction of the upward impulse from January.

Google is likely to rise further toward the next resistance 2150.00 (which stopped the previous impulse wave 1 last month).

The FxPro Tech Analysis Team

The FxPro technical experts prepare a daily analysis of the most active currency pairs (majors, crosses, exotics) and commodities. Selected instruments are reviewed on daily trends (D1, H4), using the active Elliott Wave setups, Japanese candlesticks, indicators, and support/resistance levels.

Share
Published by
The FxPro Tech Analysis Team
Tags: google

Recent Posts

A new stage of Bitcoin’s decline 

Market Picture  Bitcoin's closing price on Tuesday became the lowest since late February, confirming the…

3 hours ago

Ebay Wave Analysis 30 April 2024

- Ebay under the bearish pressure - Likely to fall to support level 51.00 Ebay…

16 hours ago

GBPAUD Wave Analysis 30 April 2024

- GBPAUD reversed from key support level 1.9135 - Likely to rise to resistance level…

16 hours ago

Silver: a possible long road down

Silver has lost 2.6% since the start of the day on Tuesday to $26.4 per…

19 hours ago

Another Dip in Crypto Capitalization

Market picture  The crypto market capitalisation decreased by another 1.5% to $2.27 trillion, getting closer…

23 hours ago

ANF Wave Analysis 29 April 2024

ANF reversed from key support level 113.40 Likely to rise to resistance level 132.31 ANF…

2 days ago

This website uses cookies