Categories: Technical analysis

Google Wave Analysis 4 April 2024

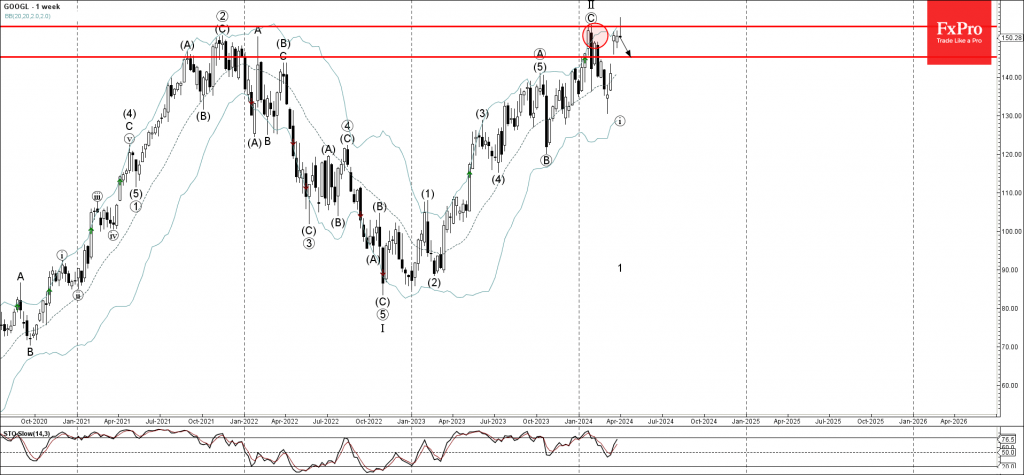
– Google reversed from key resistance level 153.20

– Likely to fall to support level 145.25

Google recently reversed down from the major resistance zone located between the key resistance level 153.20 (which stopped the weekly uptrend at the start of this year) and the upper weekly Bollinger Band.

The downward reversal from this resistance zone is likely to form the weekly reversal pattern Shooting Star Doji – if Google closes this week near the current levels.

Given the strength of the resistance level 153.20 and the bearish divergence on the daily Stochastic indicator, Google can be expected to fall further to the next support level 145.25.

The FxPro Tech Analysis Team

The FxPro technical experts prepare a daily analysis of the most active currency pairs (majors, crosses, exotics) and commodities. Selected instruments are reviewed on daily trends (D1, H4), using the active Elliott Wave setups, Japanese candlesticks, indicators, and support/resistance levels.

Share
Published by
The FxPro Tech Analysis Team
Tags: google

Recent Posts

Solana Wave Analysis – 5 December 2025

Solana: ⬇️ Sell - Solana reversed from resistance zone - Likely to fall to support…

2 hours ago

EURAUD Wave Analysis – 5 December 2025

EURAUD : ⬇️ Sell - EURAUD broke the support level 1.7600 - Likely to fall…

2 hours ago

Forex has set its priorities

In 2026, experts favour the yen, see modest euro growth, and expect pressure on the…

6 hours ago

Bear market rebound in crypto is likely to continue

Crypto rebounds continue; Bitcoin faces resistance, with a mixed market outlook ahead, as regulatory changes…

7 hours ago

Coca-Cola Wave Analysis – 4 December 2025

Coca-Cola: ⬇️ Sell - Coca-Cola reversed from long-term resistance level 73.25 - Likely to fall to…

20 hours ago

DraftKings Wave Analysis – 4 December 2025

DraftKings: ⬆️ Buy - DraftKings reversed from support zone - Likely to rise to resistance level…

20 hours ago

This website uses cookies