Categories: Technical analysis

Google Wave Analysis 24 August 2023

– Google reversed from resistance level 133.00

– Likely to fall to support level 127.90

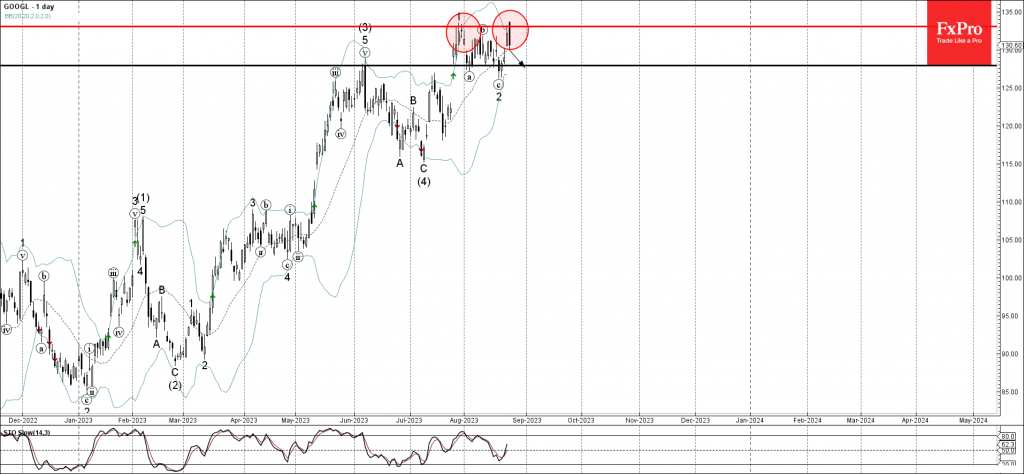
Google today reversed down from the strong resistance level 133.00 (which stopped the previous impulse wave 1 at the end of July) intersecting with the upper daily Bollinger Band.

The downward reversal from the resistance level 133.stopped the earlier short-term impulse wave 3 of the intermediate impulse wave (5) from July.

Given the strength of the resistance level 133.00, Google can be expected to fall further toward the next support level 127.90 (which reversed earlier waves a and 2).

The FxPro Tech Analysis Team

The FxPro technical experts prepare a daily analysis of the most active currency pairs (majors, crosses, exotics) and commodities. Selected instruments are reviewed on daily trends (D1, H4), using the active Elliott Wave setups, Japanese candlesticks, indicators, and support/resistance levels.

Share
Published by
The FxPro Tech Analysis Team
Tags: google

Recent Posts

EURCAD Wave Analysis 6 September 2024

- EURCAD reversed from pivotal support level 1.4900 - Likely to rise to resistance level…

2 days ago

EURUSD Wave Analysis 6 September 2024

- EURUSD reversed from support level 1.1030 - Likely to rise to resistance level 1.1200…

2 days ago

Further Unwinding of Carry Trade

The unwinding of the carry trade in the FX market continues, with the major safe…

2 days ago

Bitcoin pressured by risk-off mood

Market Picture The pressure on risk assets continues, pushing the crypto market capitalisation back below…

2 days ago

AUDUSD Wave Analysis 5 September 2024

- AUDUSD reversed from support level 0.6700 - Likely to rise to resistance level 0.6800…

2 days ago

Gold Wave Analysis 5 September 2024

- Gold reversed from support level 2475.00 - Likely to rise to resistance level 2535.00…

2 days ago

This website uses cookies