Categories: Technical analysis

Google Wave Analysis – 21 July 2025

Google: ⬆️ Buy

– Google broke resistance zone

– Likely to rise to resistance 191.65

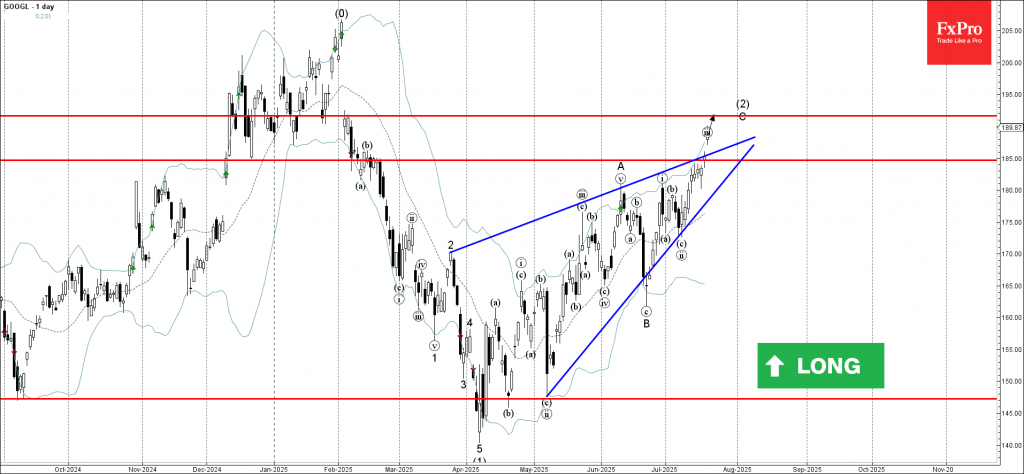
Google recently broke the resistance zone between the resistance level 185.00 and the upper trendline of the daily Rising Wedge from the start of May.

The breakout of this resistance zone accelerated the active impulse wave C of the intermediate ABC correction (2) from the start of April.

Given the clear daily uptrend, Google can be expected to rise further to the next resistance 191.65 (target price for the completion of the active impulse wave C).

The FxPro Tech Analysis Team

The FxPro technical experts prepare a daily analysis of the most active currency pairs (majors, crosses, exotics) and commodities. Selected instruments are reviewed on daily trends (D1, H4), using the active Elliott Wave setups, Japanese candlesticks, indicators, and support/resistance levels.

Share
Published by
The FxPro Tech Analysis Team
Tags: google

Recent Posts

Geopolitics will destroy the euro

•    EURUSD falls due to geopolitics and expectations of tariff removal •    Gold returns to…

2 hours ago

Platinum Wave Analysis – 8 January 2026

Platinum: ⬇️ Sell - Platinum reversed from pivotal resistance level 150.00 - Likely to fall to…

15 hours ago

Baidu Wave Analysis – 8 January 2026

Baidu: ⬇️ Sell - Baidu reversed from resistance zone - Likely to fall to support level…

15 hours ago

EURUSD Wave Analysis – 8 January 2026

EURUSD: ⬇️ Sell - EURUSD broke daily up channel - Likely to fall to support…

17 hours ago

WTI crude oil Wave Analysis – 8 January 2026

WTI crude oil: ⬆️ Buy - WTI crude oil reversed from support zone - Likely…

17 hours ago

Do not underestimate dollar

Positive macro statistics for the US are helping the greenback. Gold could rise to $4,610…

24 hours ago

This website uses cookies