Categories: Technical analysis

Google Wave Analysis – 16 June 2025

Google: ⬆️ Buy

– Google reversed from support level 175.00

– Likely to rise to the resistance level 180.00

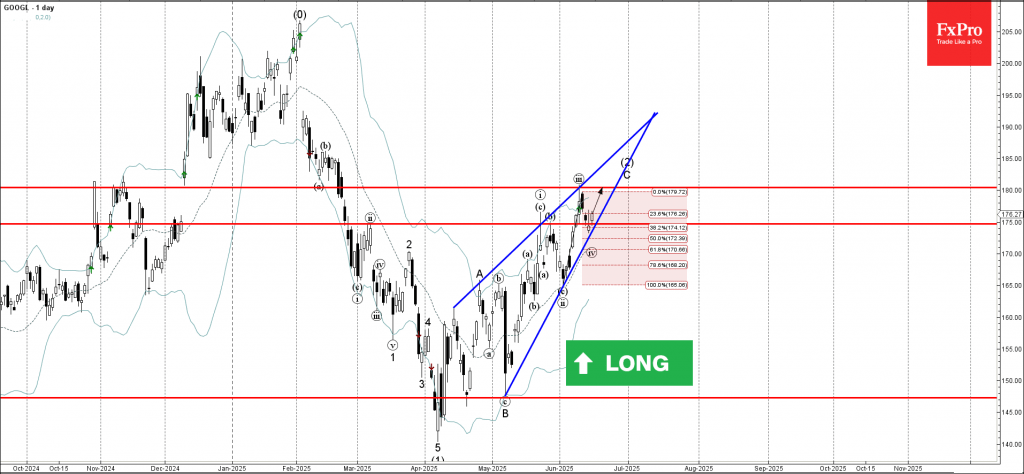
Google recently reversed up from the support zone between the support level 175.00 (former Double Top from May) and the 38.2% Fibonacci correction of the sharp upward impulse iii from the start of June.

The upward reversal from this support zone started the active minor impulse wave v of the C-wave from the start of May.

Google can be expected to rise further in the active Rising Wedge chart pattern to the next resistance level 180.00 (which stopped the previous impulse wave (iii) earlier this month).

The FxPro Tech Analysis Team

The FxPro technical experts prepare a daily analysis of the most active currency pairs (majors, crosses, exotics) and commodities. Selected instruments are reviewed on daily trends (D1, H4), using the active Elliott Wave setups, Japanese candlesticks, indicators, and support/resistance levels.

Share
Published by
The FxPro Tech Analysis Team
Tags: google

Recent Posts

Do not underestimate dollar

Positive macro statistics for the US are helping the greenback. Gold could rise to $4,610…

1 hour ago

Crypto fails to find support for a breakout

Crypto markets fell amid caution; Bitcoin and Ethereum face technical and investor shifts, with privacy…

2 hours ago

SP500. Current situation #sp500 #tradelikeapro #trading #trandingshorts #tradingstrategy #fxpro

Today is Thursday, January 8th, and we continue talking about the markets. Today, we will…

3 hours ago

NZDCAD Wave Analysis – 7 January 2026

NZDCAD: ⬆️ Buy - NZDCAD reversed from support zone - Likely to rise to resistance…

16 hours ago

Bitcoin Wave Analysis – 7 January 2026

Bitcoin: ⬇️ Sell - Bitcoin reversed from resistance zone - Likely to fall to support…

16 hours ago

EURGBP Wave Analysis – 7 January 2026

EURGBP: ⬆️ Buy - EURGBP reversed from support zone - Likely to rise to resistance…

16 hours ago

This website uses cookies