Categories: Technical analysis

Goldman Sachs Wave Analysis 9 May 2024

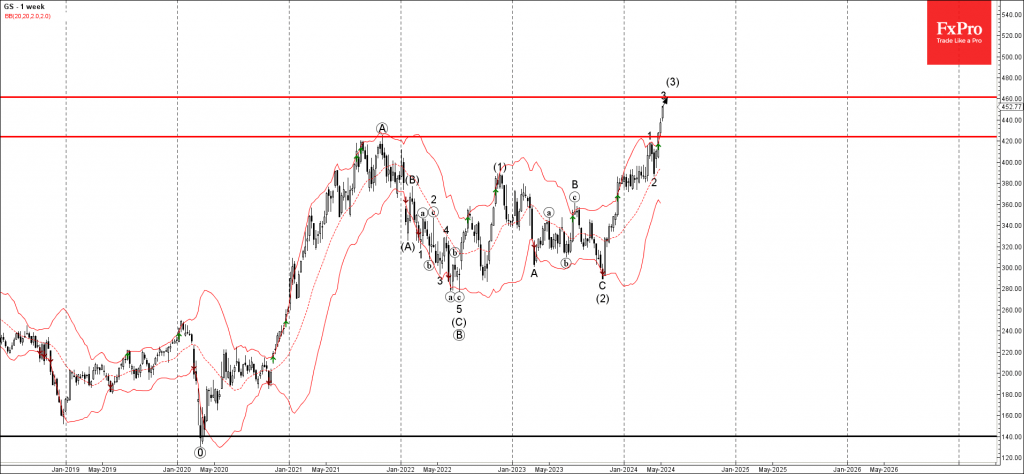
– Goldman Sachs rising inside impulse waves 3 and (3)

– Likely to rise to resistance level 460.00


Goldman Sachs rising strongly after the price broke the major resistance level 424.00 (which stopped the previous sharp uptrend at the end of May, as can be seen from the daily Goldman Sachs chart below).

The breakout of the resistance level 424.00 accelerated the active impulse waves 3 and (3).

Given the clear daily and the weekly uptrends Goldman Sachs can be expected to rise further to the next resistance level 460.00, target price for the completion of the active impulse wave 3.

The FxPro Tech Analysis Team

The FxPro technical experts prepare a daily analysis of the most active currency pairs (majors, crosses, exotics) and commodities. Selected instruments are reviewed on daily trends (D1, H4), using the active Elliott Wave setups, Japanese candlesticks, indicators, and support/resistance levels.

Share
Published by
The FxPro Tech Analysis Team
Tags: Goldman

Recent Posts

Solana Wave Analysis – 5 December 2025

Solana: ⬇️ Sell - Solana reversed from resistance zone - Likely to fall to support…

2 hours ago

EURAUD Wave Analysis – 5 December 2025

EURAUD : ⬇️ Sell - EURAUD broke the support level 1.7600 - Likely to fall…

2 hours ago

Forex has set its priorities

In 2026, experts favour the yen, see modest euro growth, and expect pressure on the…

6 hours ago

Bear market rebound in crypto is likely to continue

Crypto rebounds continue; Bitcoin faces resistance, with a mixed market outlook ahead, as regulatory changes…

7 hours ago

Coca-Cola Wave Analysis – 4 December 2025

Coca-Cola: ⬇️ Sell - Coca-Cola reversed from long-term resistance level 73.25 - Likely to fall to…

20 hours ago

DraftKings Wave Analysis – 4 December 2025

DraftKings: ⬆️ Buy - DraftKings reversed from support zone - Likely to rise to resistance level…

20 hours ago

This website uses cookies