Categories: Technical analysis

Goldman Sachs Wave Analysis 29 March, 2021

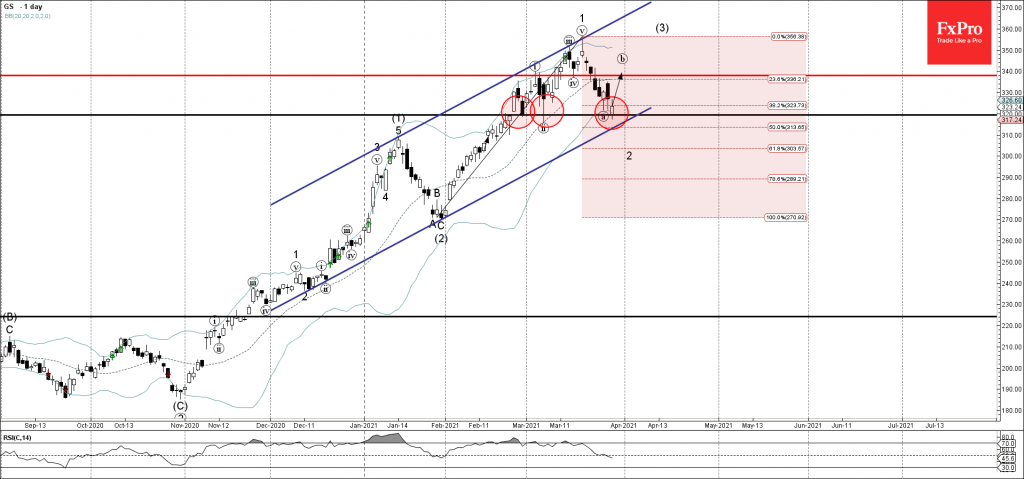
• Goldman Sachs reversed from support level 320.00

• Likely to reach resistance level 340.00

Goldman Sachs recently reversed up from the key support level 320.00 (which has been reversing the price from the end of February).

The support zone near the support level 320.00 was strengthened by the lower daily Bollinger Band and by the 38.2% Fibonacci correction of the upward impulse 1 from January.

Given the clear daily uptrend – Goldman Sachs is likely rise further toward the next resistance level 340.00 (former support from the middle of March).

The FxPro Tech Analysis Team

The FxPro technical experts prepare a daily analysis of the most active currency pairs (majors, crosses, exotics) and commodities. Selected instruments are reviewed on daily trends (D1, H4), using the active Elliott Wave setups, Japanese candlesticks, indicators, and support/resistance levels.

Share
Published by
The FxPro Tech Analysis Team

Recent Posts

Adobe Wave Analysis 3 May 2024

- Adobe reversed from support zone - Likely to rise to resistance level 500.00 Adobe…

2 days ago

EURGBP Wave Analysis 3 May 2024

- EURJPY reversed from support zone - Likely to rise to resistance level 0.8625 EURGBP…

2 days ago

How Low Can the USDJPY Go?

USDJPY was slipping below 153 on Friday morning, a three-week low and having lost over…

2 days ago

Bitcoin’s Downtrend, Solana and Ethereum Form Double Bottom

Market picture  Crypto market capitalisation rose 3.3% in 24 hours to $2.22 trillion. Local capitalisation…

2 days ago

EURJPY Wave Analysis 2 May 2024

- EURJPY under strong bearish pressure - Likely to fall to support level 163.10 EURJPY…

3 days ago

WTI crude oil Wave Analysis 2 May 2024

- WTI broke round support level 80.00 - Likely to fall to support level 76.00…

3 days ago

This website uses cookies