Categories: Technical analysis

Goldman Sachs Wave Analysis – 14 May, 2024

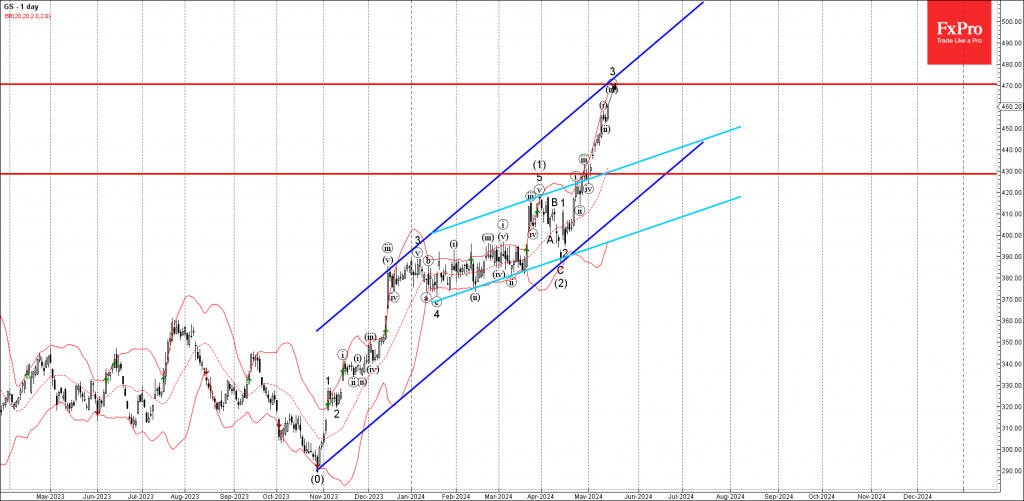
• Goldman Sachs broke the key resistance level 430.00

• Likely to rise to resistance level 470.00

Goldman Sachs continues to rise inside the accelerated impulse wave 3, which previously broke the key  resistance level 430.00.

The breakout of the resistance level 430.00 coincided with the breakout of the daily up channel from the start of January.

Give the clear daily uptrend, Goldman Sachs can be expected to rise further toward the next resistance level 470.00, target for the completion of the active impulse wave 3.

The FxPro Tech Analysis Team

The FxPro technical experts prepare a daily analysis of the most active currency pairs (majors, crosses, exotics) and commodities. Selected instruments are reviewed on daily trends (D1, H4), using the active Elliott Wave setups, Japanese candlesticks, indicators, and support/resistance levels.

Share
Published by
The FxPro Tech Analysis Team

Recent Posts

NZDCAD Wave Analysis – 7 January 2026

NZDCAD: ⬆️ Buy - NZDCAD reversed from support zone - Likely to rise to resistance…

7 hours ago

Bitcoin Wave Analysis – 7 January 2026

Bitcoin: ⬇️ Sell - Bitcoin reversed from resistance zone - Likely to fall to support…

7 hours ago

EURGBP Wave Analysis – 7 January 2026

EURGBP: ⬆️ Buy - EURGBP reversed from support zone - Likely to rise to resistance…

7 hours ago

Brent Crude Oil Wave Analysis – 7 January 2026

Brent Crude Oil: ⬇️ Sell - Brent Crude Oil reversed from resistance zone - Likely…

7 hours ago

Old fears about the euro have returned

The resurgence of the political crisis in France is weighing on EURUSD The US dollar…

16 hours ago

The crypto market has hit the upper limit of its rebound

The crypto market faces resistance at $3.2T; sentiment rises, but selling pressure persists. Bitcoin and…

19 hours ago

This website uses cookies