Categories: Technical analysis

Goldman Sachs Wave Analysis – 06 November, 2019

  • Goldman Sachs reversed from resistance zone
  • Likely to fall to 212.00

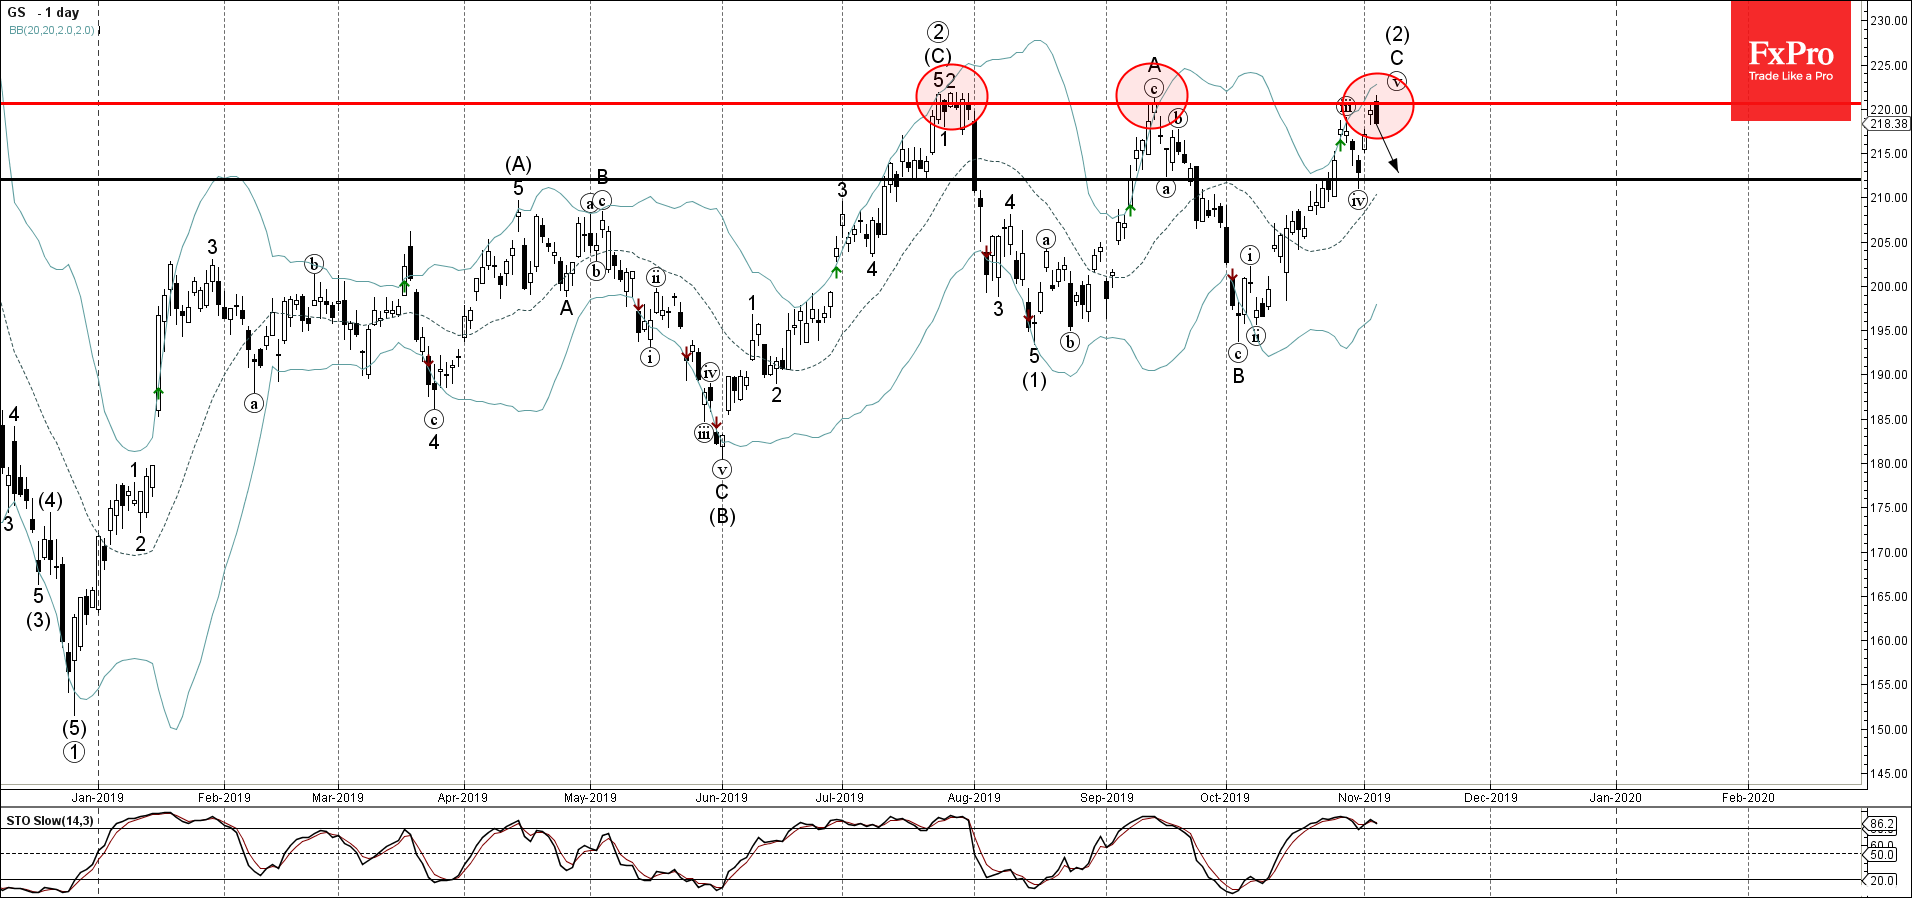
Goldman Sachs recently reversed down from the resistance area lying between the multi-month resistance level 220.00 (which has been reversing the price from July) and the upper daily Bollinger Band.

The downward reversal from this resistance area stopped the earlier medium-term ABC correction (2) from August.

Given the overbought daily Stochastic – Goldman Sachs is expected to fall further and retest the next support level 212.00 (low of the previous minor correction (iv)).

AddThis Website Tools
The FxPro Tech Analysis Team

The FxPro technical experts prepare a daily analysis of the most active currency pairs (majors, crosses, exotics) and commodities. Selected instruments are reviewed on daily trends (D1, H4), using the active Elliott Wave setups, Japanese candlesticks, indicators, and support/resistance levels.

Share
Published by
The FxPro Tech Analysis Team
Tags: GS

Recent Posts

Apple Wave Analysis – 20 March 2025

Apple: ⬇️ Sell - Apple reversed from resistance level 220.00 - Likely to fall to…

16 hours ago

IBM Wave Analysis – 20 March 2025

IBM: ⬆️ Buy - IBM reversed from support zone - Likely to rise to resistance…

16 hours ago

AUDNZD Wave Analysis – 20 March 2025

AUDNZD: ⬆️ Buy - AUDNZD reversed from key support level 1.0930 - Likely to rise…

19 hours ago

EURCAD Wave Analysis – 20 March 2025

EURCAD: ⬇️ Sell - EURCAD reversed from the resistance zone - Likely to fall to…

19 hours ago

Crypto Market Testing Resistance

The crypto market has increased by over 5% and is nearing the $2.9 trillion. The…

24 hours ago

Gold Wave Analysis – 19 March 2025

Gold: ⬆️ Buy - Gold continues daily uptrend - Likely to rise to resistance level…

2 days ago