Categories: Technical analysis

Gold Wave Analysis 9 March, 2021

• Gold reversed from long-term support level 1680.00

• Likely to reach resistance level 1761.00

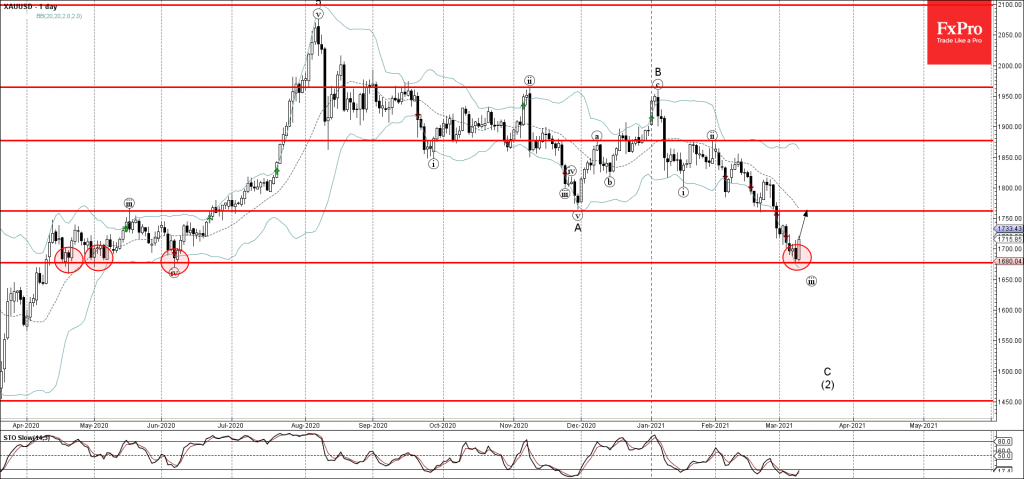
Gold recently reversed up from the long-term support level 1680.00, which has been reversing the price from last April July as can be seen from the daily Gold chart below.

The support zone near the support level 1680.00 was strengthened by the lower daily Bollinger Band.

Given the strength of the support level 1680.00 and the oversold daily Stochastic – Gold is likely to rise further toward the next resistance level 1761.00 (former support from November and February).

The FxPro Tech Analysis Team

The FxPro technical experts prepare a daily analysis of the most active currency pairs (majors, crosses, exotics) and commodities. Selected instruments are reviewed on daily trends (D1, H4), using the active Elliott Wave setups, Japanese candlesticks, indicators, and support/resistance levels.

Share
Published by
The FxPro Tech Analysis Team
Tags: gold

Recent Posts

USDJPY Wave Analysis 26 April 2024

- USDJPY broke key resistance level 155.00 - Likely to rise to resistance level 160.00…

2 days ago

Ebay Wave Analysis 26 April 2024

- Ebay reversed from support level 49.35 - Likely to rise to resistance level 52.55…

2 days ago

False Alert with Yen Interventions?

Even though the Bank of Japan left the key rate and parameters of the QE…

2 days ago

Cooler Bitcoin

Market picture  Market Dynamics: The cryptocurrency market stabilised, losing just 0.1% of capitalisation and dropping to…

2 days ago

GBPCAD Wave Analysis 25 April 2024

- GBPCAD reversed from key support level 1.6910 - Likely to rise to resistance level…

3 days ago

GBPAUD Wave Analysis 25 April 2024

- GBPAUD reversed from support level 1.9135 - Likely to rise to resistance level 1.9360…

3 days ago

This website uses cookies