Categories: Technical analysis

Gold Wave Analysis 8 January, 2021

• Gold reversed from resistance level 1965,00

• Likely to fall to 1828,00

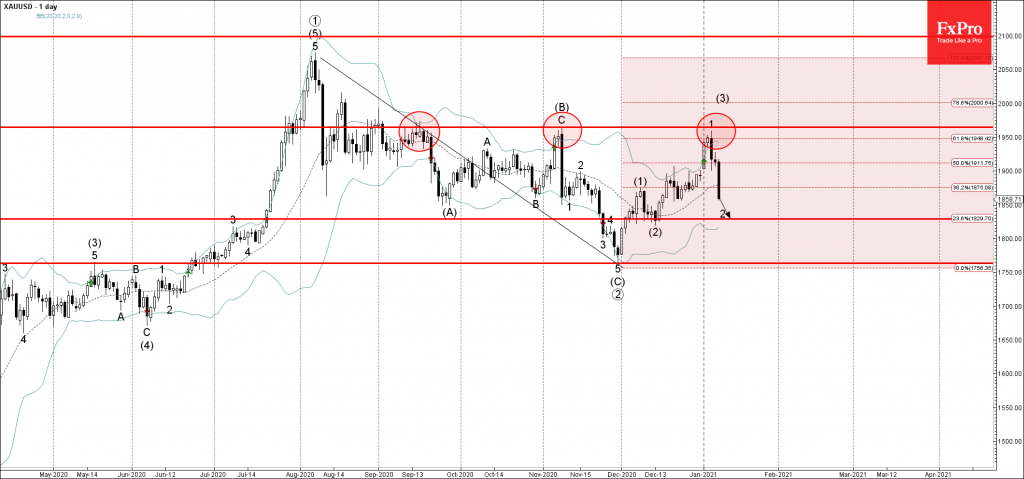
Gold recently reversed down from the pivotal resistance level 1965,00 (which has been reversing the price from September) standing close to the upper daily Bollinger Band and the 61,8% Fibonacci correction of the downward correction from August.

The downward reversal from the resistance level 1965,00 created the daily Japanese candlesticks reversal pattern Evening Star.

Gold is expected to fall further toward the next support level 1828,00 (low of wave (2) from December and the target price for the completion of the active wave 2).

The FxPro Tech Analysis Team

The FxPro technical experts prepare a daily analysis of the most active currency pairs (majors, crosses, exotics) and commodities. Selected instruments are reviewed on daily trends (D1, H4), using the active Elliott Wave setups, Japanese candlesticks, indicators, and support/resistance levels.

Share
Published by
The FxPro Tech Analysis Team
Tags: XAUUSD

Recent Posts

Brent Crude oil Wave Analysis – 13 January 2026

Brent Crude oil ⬆️ Buy - Brent Crude oil rising inside impulse wave c -…

7 hours ago

USDJPY Wave Analysis – 13 January 2026

USDJPY ⬆️ Buy - USDJPY broke resistance area - Likely to rise to resistance level…

7 hours ago

Exxon Mobil Wave Analysis – 13 January 2026

Exxon Mobil ⬆️ Buy - Exxon Mobil broke resistance level 125.60 - Likely to rise…

7 hours ago

BNB Wave Analysis – 13 January 2026

Brent Crude oil ⬆️ Buy - BNB broke out of sideways price range - Likely…

7 hours ago

A slightly weaker CPI was not enough to break through the highs

US CPI data a bit softer than forecasts, sparking brief market optimism, but resistance remains.…

13 hours ago

Pro News Flash: Global Tensions Fuel a Fresh Oil Rally

🛢️ Oil prices are finding fresh strength as geopolitical tensions in the Middle East reignite…

13 hours ago

This website uses cookies