Categories: Technical analysis

Gold Wave Analysis – 10 February 2025


– Gold broke resistance area
– Likely to rise to resistance level 2950.00

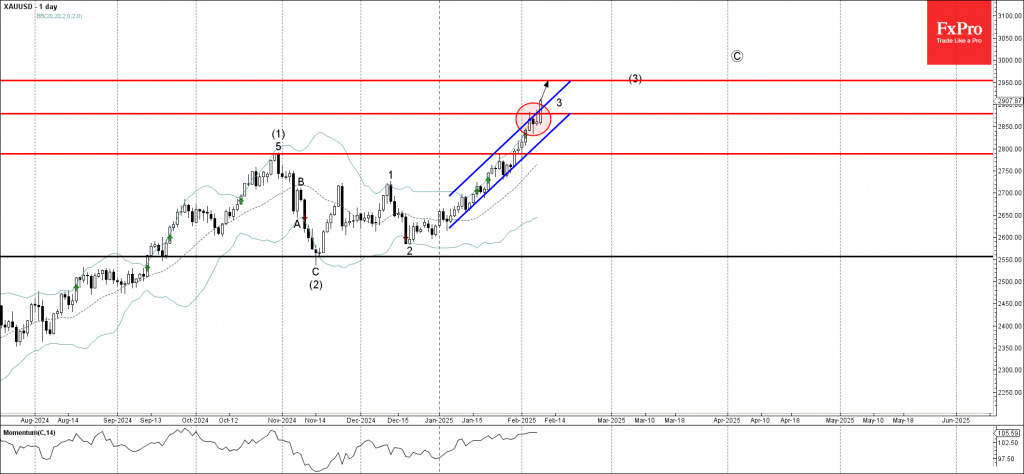
Gold continues to rise strongly after the earlier breakout of the resistance area located between the key resistance level 2878.00 (which stopped the price at the start of February) and the resistance trendline of the daily up channel from the start of this year.

The breakout of this resistance area accelerated the active short-term impulse wave 3 of the higher-order impulse wave (3).

Given the strong uptrend that can be seen on the daily and the weekly charts, Gold can be expected to rise to the next resistance level 2950.00, target price for the completion of the active impulse sequence (3).

AddThis Website Tools
The FxPro Tech Analysis Team

The FxPro technical experts prepare a daily analysis of the most active currency pairs (majors, crosses, exotics) and commodities. Selected instruments are reviewed on daily trends (D1, H4), using the active Elliott Wave setups, Japanese candlesticks, indicators, and support/resistance levels.

Share
Published by
The FxPro Tech Analysis Team
Tags: gold

Recent Posts

Tesla Wave Analysis – 21 March 2025

Tesla: ⬆️ Buy - Tesla reversed from support level 220.00 - Likely to rise to…

2 days ago

Google Wave Analysis – 21 March 2025

Google: ⬆️ Buy - Google reversed from key support level 160.00 - Likely to rise…

2 days ago

Silver Wave Analysis – 21 March 2025

Silver: ⬇️ Sell - Silver reversed from resistance level 34.00 - Likely to fall to…

2 days ago

USDCHF Wave Analysis – 21 March 2025

USDCHF: ⬆️ Buy - USDCHF reversed from support level 0,8750 - Likely to fall to…

2 days ago

What’s next: Flash PMIs, UK CPI & US PCE

The week ahead includes the release of the PMI business activity indexes for March, the…

2 days ago

Gold: Growth Opportunities

Gold has been in an uptrend, reaching record highs and offering growth opportunities. However, caution…

2 days ago