Categories: Technical analysis

Gold Wave Analysis – 4 November, 2022

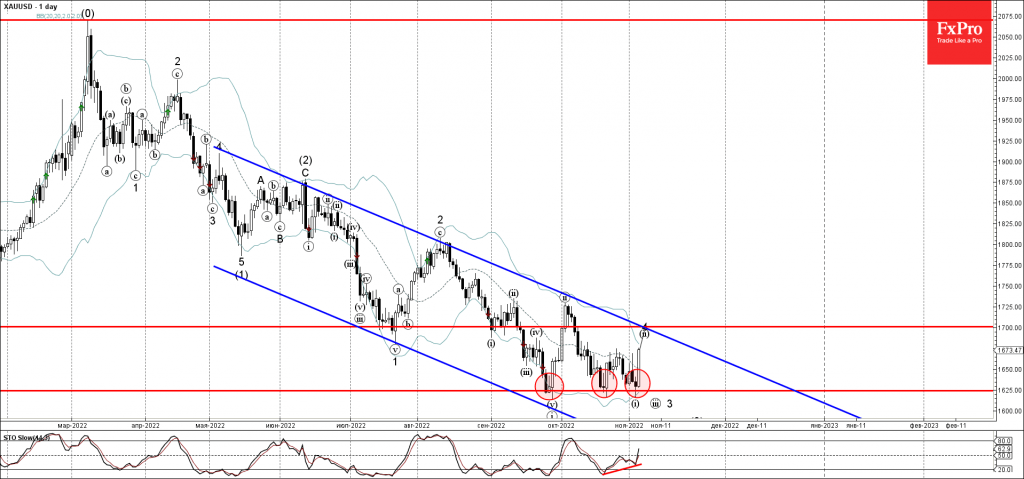
• Gold reversed from strong support level 1625.00

• Likely to rise to resistance level 1700.00

Gold recently reversed up from the strong support level 1625.00 (which has been reversing the price from the end of September) – strengthened by the lower daily Bollinger Band.

The upward reversal from the support level 1625.00 started the active short-term correction (ii).

Given the bullish divergence on the daily Stochastic indicator, Gold can be expected to rise further toward the next resistance level 1700.00, coinciding with the resistance trendline of the daily down channel from May.

The FxPro Tech Analysis Team

The FxPro technical experts prepare a daily analysis of the most active currency pairs (majors, crosses, exotics) and commodities. Selected instruments are reviewed on daily trends (D1, H4), using the active Elliott Wave setups, Japanese candlesticks, indicators, and support/resistance levels.

Share
Published by
The FxPro Tech Analysis Team
Tags: gold

Recent Posts

Crypto Market Retreats Due to Overhang of Sellers

Market picture The crypto market has lost 3.3% in the last 24 hours to $2.3…

5 hours ago

USDJPY Wave Analysis 26 April 2024

- USDJPY broke key resistance level 155.00 - Likely to rise to resistance level 160.00…

3 days ago

Ebay Wave Analysis 26 April 2024

- Ebay reversed from support level 49.35 - Likely to rise to resistance level 52.55…

3 days ago

False Alert with Yen Interventions?

Even though the Bank of Japan left the key rate and parameters of the QE…

3 days ago

Cooler Bitcoin

Market picture  Market Dynamics: The cryptocurrency market stabilised, losing just 0.1% of capitalisation and dropping to…

3 days ago

GBPCAD Wave Analysis 25 April 2024

- GBPCAD reversed from key support level 1.6910 - Likely to rise to resistance level…

4 days ago

This website uses cookies