Categories: Technical analysis

Gold Wave Analysis 4 January, 2021

• Gold rising sharply

• Likely to rise to 1965.00

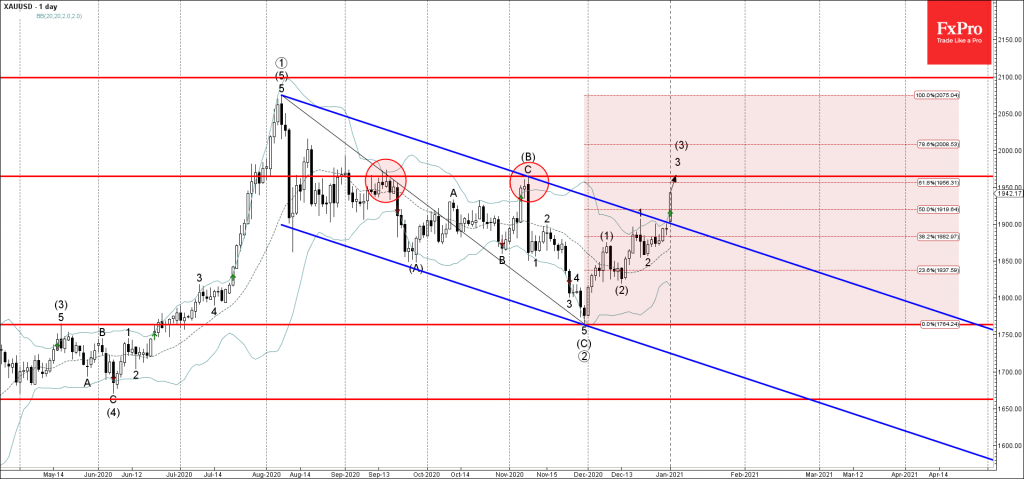
Gold continues to rise sharply after the price broke through the pivotal resistance level 1900.00 (which stopped the previous waves 2 and 1).

The breakout of the resistance level 1900.00 coincided with the breakout of the daily down channel from August – which accelerated the active impulse waves 3 and (3).

Gold is expected to rise further to the next resistance level 1965.00 (monthly high from September and November of 2020).

The FxPro Tech Analysis Team

The FxPro technical experts prepare a daily analysis of the most active currency pairs (majors, crosses, exotics) and commodities. Selected instruments are reviewed on daily trends (D1, H4), using the active Elliott Wave setups, Japanese candlesticks, indicators, and support/resistance levels.

Share
Published by
The FxPro Tech Analysis Team

Recent Posts

Video: Dollar and Indices are trying to find footing after the fall

The dollar experienced a sell-off but rallied back up by the end of the week.…

2 days ago

What is next: BoJ, Fed, SNB & BoE Rates

The new week will be packed with economic data and decisions from key central banks.…

2 days ago

Dollar attempts to rebound after oversold conditions

Despite economic factors working against the dollar, its oversold condition helped it this week or…

2 days ago

USDCAD Wave Analysis – 14 March 2025

USDCAD: ⬇️ Sell - USDCAD reversed from key resistance level 1.4500 - Likely to fall…

2 days ago

Solana Wave Analysis – 14 March 2025

Solana: ⬆️ Buy - Solana reversed from the long-term support level 113.75 - Likely to…

2 days ago

Adobe Wave Analysis – 13 March 2025

Adobe: ⬇️ Sell - Adobe broke round support level 400.00 - Likely to fall to…

3 days ago

This website uses cookies