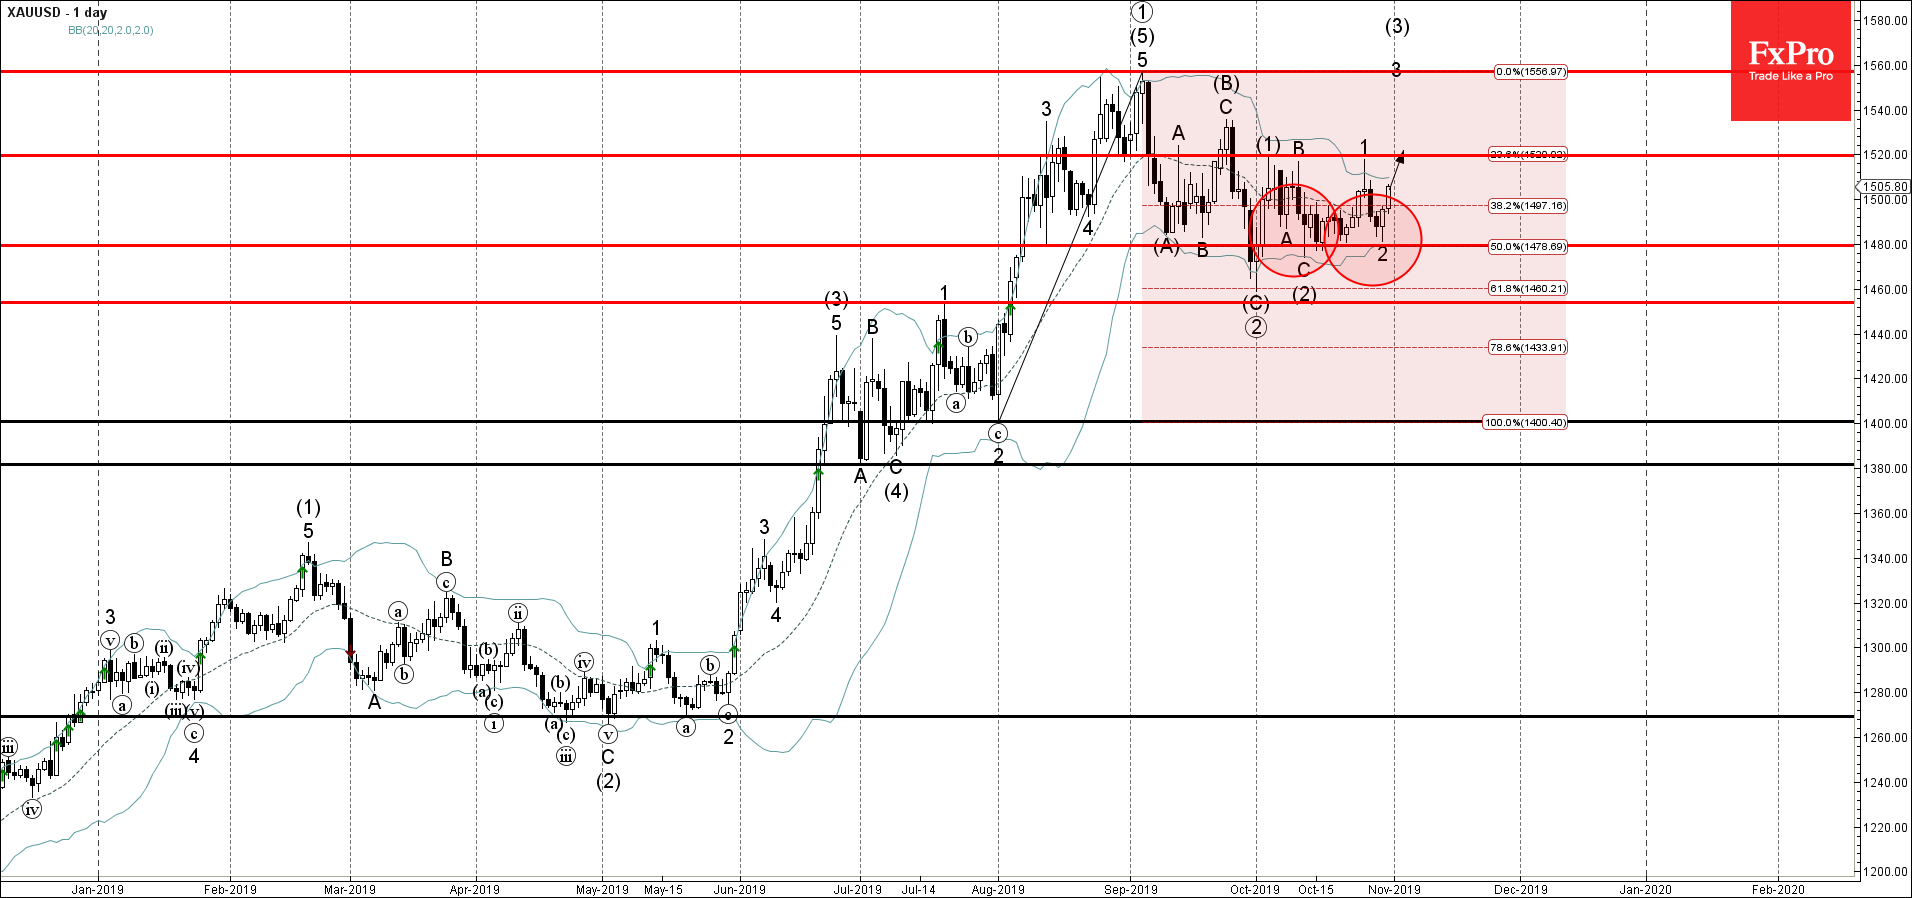
- Gold reversed from support zone
- Likely to rise to 1520.00
Gold recently reversed up from support area lying between the key support level 1480.00 (which has been reversing the price from September), lower daily Bollinger Band and the 50% Fibonacci correction of the previous upward impulse from the start of August.
The upward reversal from this support area started the active short-term impulse wave 3.
Gold is expected to rise further and retest the next resistance level 1520.00 (top of the previous impulse wave 1).