Categories: Technical analysis

Gold Wave Analysis – 31 August, 2022

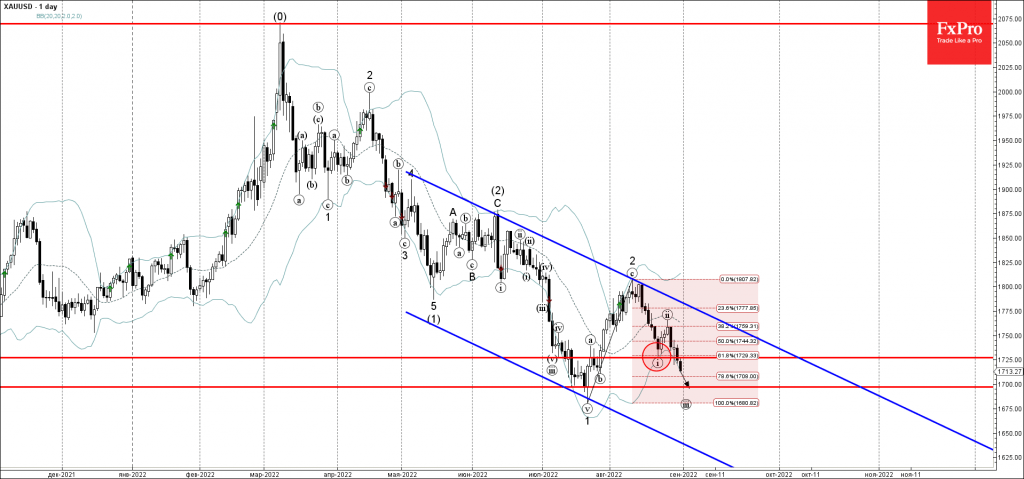
• Gold broke support level 1725.00

• Likely to fall to support level 1700.00

Gold recently broke the support level 1725.00 intersecting with the 61.8% Fibonacci correction of the upward correction 2 from July.

The breakout of the support level 1725.00 accelerated the active short-term impulse waves (iii) and 3, which belong to the intermediate impulse wave (3) from June.

Gold can be expected to fall further toward the next round support level 1700.00 (which stopped the previous impulse wave 1 in July).

AddThis Website Tools
The FxPro Tech Analysis Team

The FxPro technical experts prepare a daily analysis of the most active currency pairs (majors, crosses, exotics) and commodities. Selected instruments are reviewed on daily trends (D1, H4), using the active Elliott Wave setups, Japanese candlesticks, indicators, and support/resistance levels.

Share
Published by
The FxPro Tech Analysis Team

Recent Posts

Video: Dollar and Indices are trying to find footing after the fall

The dollar experienced a sell-off but rallied back up by the end of the week.…

20 hours ago

What is next: BoJ, Fed, SNB & BoE Rates

The new week will be packed with economic data and decisions from key central banks.…

23 hours ago

Dollar attempts to rebound after oversold conditions

Despite economic factors working against the dollar, its oversold condition helped it this week or…

1 day ago

USDCAD Wave Analysis – 14 March 2025

USDCAD: ⬇️ Sell - USDCAD reversed from key resistance level 1.4500 - Likely to fall…

1 day ago

Solana Wave Analysis – 14 March 2025

Solana: ⬆️ Buy - Solana reversed from the long-term support level 113.75 - Likely to…

1 day ago

Adobe Wave Analysis – 13 March 2025

Adobe: ⬇️ Sell - Adobe broke round support level 400.00 - Likely to fall to…

2 days ago