Categories: Technical analysis

Gold Wave Analysis 3 January 2024

– Gold reversed from resistance level 2075.00

– Likely to fall to support level 2016.00

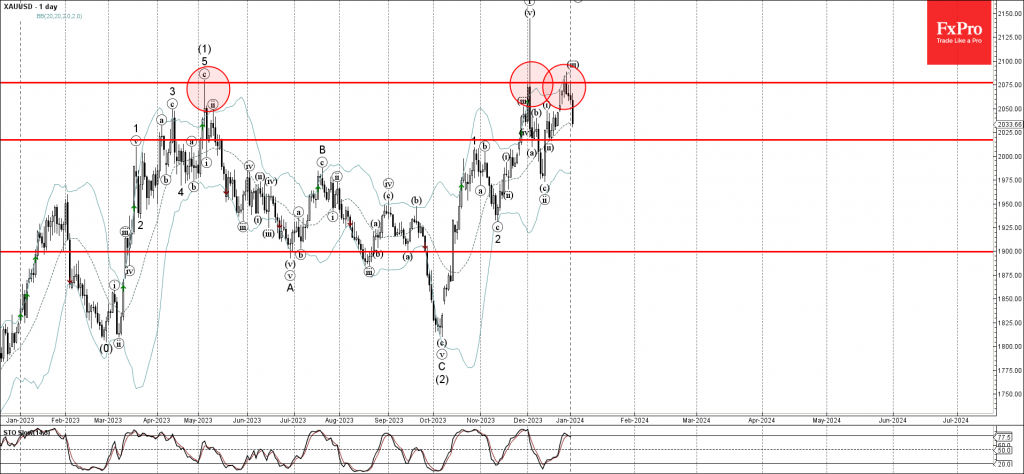
Gold recently reversed down from the strong multi-month resistance level 2075.00 (which also stopped the earlier uptrend in March of 2023, as can be seen below).

The downward reversal from the resistance level 2075.00 stopped the earlier minor impulse wave iii.

Given the strength of the resistance level 2075.00 and the strongly bullish USD sentiment, Gold can be expected to fall further to the next support level 2016.00 (low of the previous correction ii).

The FxPro Tech Analysis Team

The FxPro technical experts prepare a daily analysis of the most active currency pairs (majors, crosses, exotics) and commodities. Selected instruments are reviewed on daily trends (D1, H4), using the active Elliott Wave setups, Japanese candlesticks, indicators, and support/resistance levels.

Share
Published by
The FxPro Tech Analysis Team
Tags: gold

Recent Posts

Apple Wave Analysis 17 October 2024

- Apple reversed from key resistance level 237.00 - Likely to fall to support level 227.00…

12 hours ago

Aig Wave Analysis 17 October 2024

- Aig reversed from support level 76.60 - Likely to rise to resistance level 79.65 Aig recently…

12 hours ago

The Crypto Market Stabilises at the Top

Market Picture The cryptocurrency market remains steady at around $2.31 trillion in market capitalisation, mirroring…

21 hours ago

GBPCAD Wave Analysis 16 October 2024

- GBPCAD reversed from resistance zone - Likely to fall to support level 1.7750 GBPCAD…

1 day ago

USDCHF Wave Analysis 16 October 2024

- USDCHF broke resistance zone - Likely to rise to resistance level 0.8730 USDCHF currency…

1 day ago

Pound Suppressed by Weak Inflation

The British pound fell below the 1.30 level against the dollar after weak inflation data…

2 days ago

This website uses cookies