Categories: Technical analysis

Gold Wave Analysis – 26 March, 2020

  • Gold broke resistance zone
  • Likely to rise to 1690.00

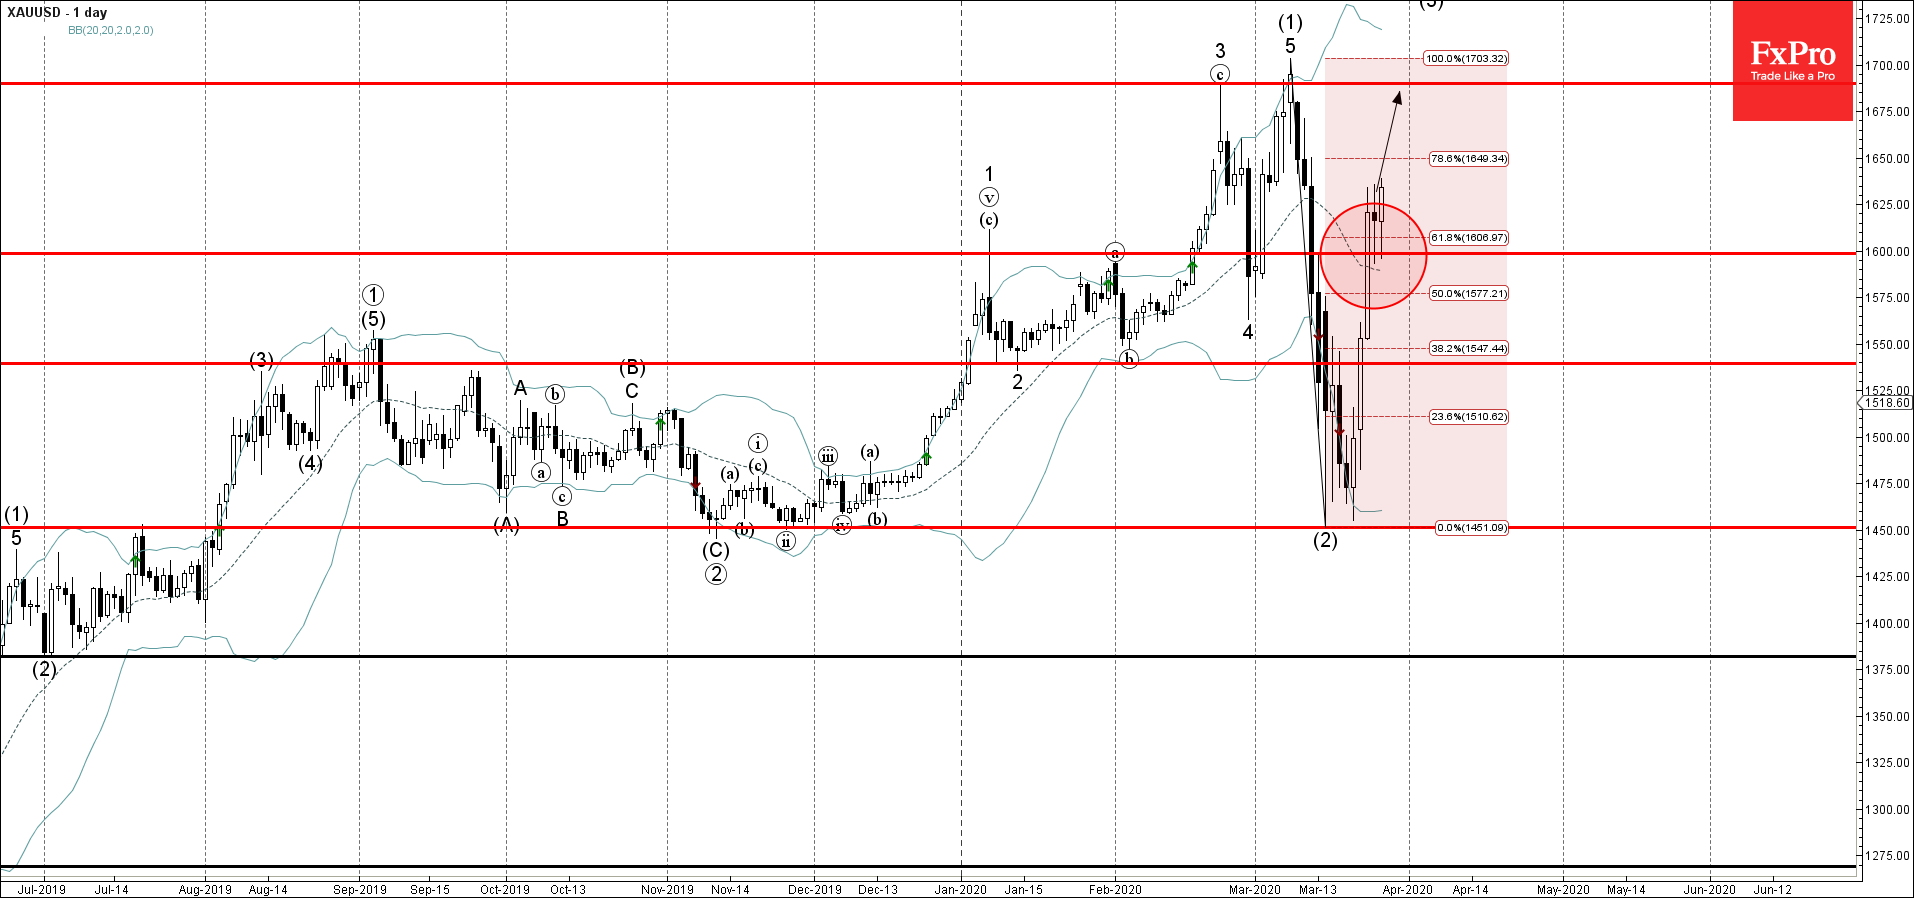
Gold under bullish pressure after the earlier breakout of the resistance zone lying between the round resistance level 1600.00 and the 61.8% Fibonacci retracement of the previous sharp downward correction (2).

The price also previously broke above the resistance level 1550.00 (set as the likely upward target in our earlier forecast for this instrument) – which accelerated the active impulse wave (3).

Gold is likely to rise further toward the next resistance level 1690.00 (which stopped the previous impulse waves 3 and (1)).

The FxPro Tech Analysis Team

The FxPro technical experts prepare a daily analysis of the most active currency pairs (majors, crosses, exotics) and commodities. Selected instruments are reviewed on daily trends (D1, H4), using the active Elliott Wave setups, Japanese candlesticks, indicators, and support/resistance levels.

Share
Published by
The FxPro Tech Analysis Team
Tags: XAUUSD

Recent Posts

Markets pick up signals from the White House

Donald Trump has no intention of dismissing Jerome Powell. The White House's decision to postpone…

3 hours ago

Nat Gas Current situation #tradelikeapro #tradingshort #tradingtips #gas #tradingstrategy #trading

Today is Thursday, January 15th. Once again we will talk about the gas market. The…

3 hours ago

Bitcoin aims to break out of a corrective rebound

Crypto market rebounds, Bitcoin eyes $100K, Dash surges, institutional demand rises, and Ethereum staking hits…

3 hours ago

Bitcoin Wave Analysis – 14 January 2026

Bitcoin: ⬆️ Buy - Bitcoin broke resistance area - Likely to rise to resistance level…

18 hours ago

NZDJPY Wave Analysis – 14 January 2026

NZDJPY: ⬇️ Sell - NZDJPY reversed down from the resistance area - Likely to fall…

18 hours ago

What is Leverage?

Leverage is a mechanism that lets traders control larger positions using smaller capital. By choosing…

23 hours ago

This website uses cookies