Categories: Technical analysis

Gold Wave Analysis 25 September 2023

– Gold reversed from key resistance level 1950.00

– Likely to fall to support level 1900.00

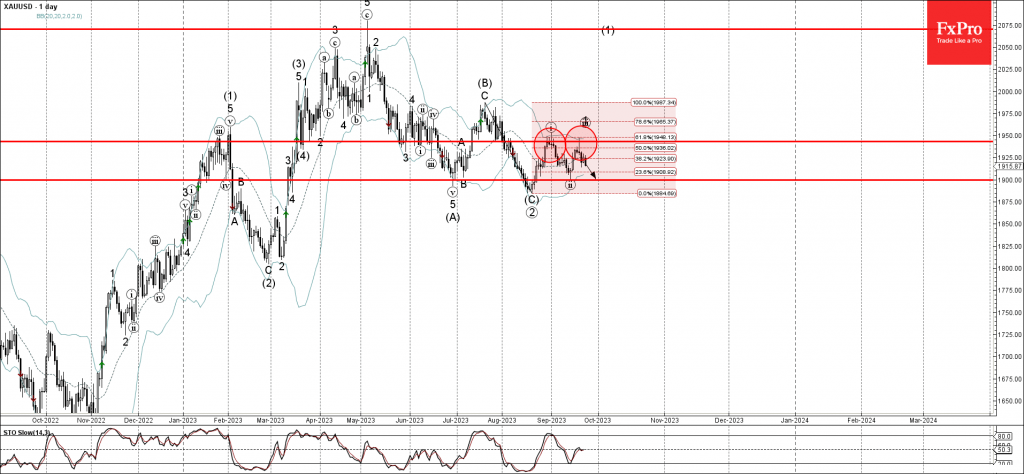
Gold recently reversed down from the key resistance level 1950.00 (top of wave I from the start of this month) intersecting with the upper daily Bollinger Band.

The resistance level 1950.00 was further strengthened by the 61.8% Fibonacci correction of the previous downward impulse (C) from July.

Gold can be expected to fall further toward the next support level 1900.00 (low of the previous minor correction ii).

The FxPro Tech Analysis Team

The FxPro technical experts prepare a daily analysis of the most active currency pairs (majors, crosses, exotics) and commodities. Selected instruments are reviewed on daily trends (D1, H4), using the active Elliott Wave setups, Japanese candlesticks, indicators, and support/resistance levels.

Share
Published by
The FxPro Tech Analysis Team
Tags: gold

Recent Posts

Video: Dollar and Indices are trying to find footing after the fall

The dollar experienced a sell-off but rallied back up by the end of the week.…

3 days ago

What is next: BoJ, Fed, SNB & BoE Rates

The new week will be packed with economic data and decisions from key central banks.…

3 days ago

Dollar attempts to rebound after oversold conditions

Despite economic factors working against the dollar, its oversold condition helped it this week or…

3 days ago

USDCAD Wave Analysis – 14 March 2025

USDCAD: ⬇️ Sell - USDCAD reversed from key resistance level 1.4500 - Likely to fall…

3 days ago

Solana Wave Analysis – 14 March 2025

Solana: ⬆️ Buy - Solana reversed from the long-term support level 113.75 - Likely to…

3 days ago

Adobe Wave Analysis – 13 March 2025

Adobe: ⬇️ Sell - Adobe broke round support level 400.00 - Likely to fall to…

3 days ago

This website uses cookies