Categories: Technical analysis

Gold Wave Analysis 24 November, 2020

• Gold broke support zone

• Likely to fall to 1763.00

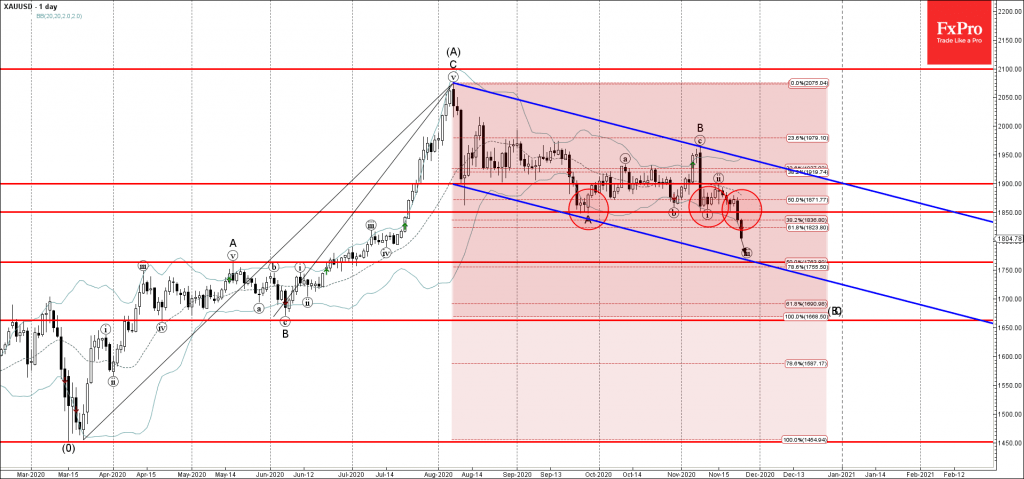
Gold recently broke the support zone located at the intersection of the powerful support level 1850.00 and the Fibonacci cluster made out of the 38.2% and 61.8% Fibonacci retracement levels of the previous upward impulses from June and March.

The breakout of this support zone accelerated the active minor impulse wave (iii), which belongs to wave C from the start of November.

Gold is likely to fall further toward the next support level 1763.00 (target price for the completion of the impulse wave (iii) and the price of the support trendline of the daily down channel from August).

The FxPro Tech Analysis Team

The FxPro technical experts prepare a daily analysis of the most active currency pairs (majors, crosses, exotics) and commodities. Selected instruments are reviewed on daily trends (D1, H4), using the active Elliott Wave setups, Japanese candlesticks, indicators, and support/resistance levels.

Share
Published by
The FxPro Tech Analysis Team
Tags: gold

Recent Posts

CHFJPY Wave Analysis – 15 January 2026

CHFJPY: ⬇️ Sell - CHFJPY reversed from resistance zone - Likely to fall to support level…

10 hours ago

WTI Crude Oil Wave Analysis – 15 January 2026

WTI Crude Oil: ⬇️ Sell - WTI Crude Oil rising inside minor impulse wave (1) -…

10 hours ago

Costco Wave Analysis – 15 January 2026

Costco: ⬆️ Buy - Costco rising inside minor impulse wave (1) - Likely to reach resistance…

10 hours ago

Chevron Wave Analysis – 15 January 2026

Chevron: ⬆️ Buy - Chevron broke strong resistance level 165.00 - Likely to rise to resistance…

10 hours ago

US Indices: growth widens, but are expectations too high?

Tech sell-off and high Q4 forecasts put the S&P 500 at risk; the Russell 2000…

16 hours ago

Markets pick up signals from the White House

Donald Trump has no intention of dismissing Jerome Powell. The White House's decision to postpone…

19 hours ago

This website uses cookies