Categories: Technical analysis

Gold Wave Analysis – 23 November, 2021

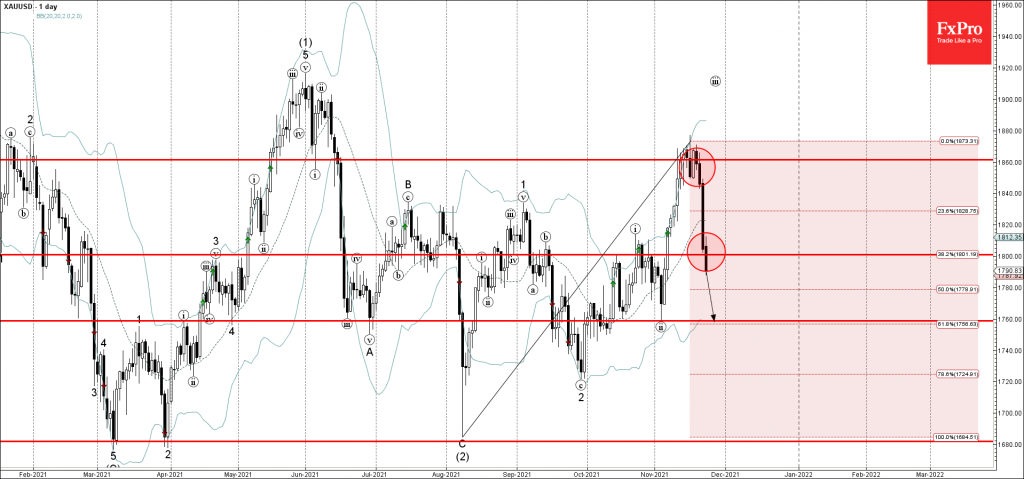
• Gold broke support zone

• Likely to fall to support level 1760.00                                                                      


Gold recently broke the support zone lying between the round support level 1800.00 and the 38.2% Fibonacci correction of the upward impulse form August.

The breakout of this support area accelerated the active short-term corrective wave (iv) form the major resistance level 1860.00.

Gold can be expected to fall further toward the next support level 1760.00 (low of the previous short-term correction (ii)).

The FxPro Tech Analysis Team

The FxPro technical experts prepare a daily analysis of the most active currency pairs (majors, crosses, exotics) and commodities. Selected instruments are reviewed on daily trends (D1, H4), using the active Elliott Wave setups, Japanese candlesticks, indicators, and support/resistance levels.

Share
Published by
The FxPro Tech Analysis Team
Tags: gold

Recent Posts

Silver: a possible long road down  

Silver has lost 2.6% since the start of the day on Tuesday to $26.4 per…

55 mins ago

Another Dip in Crypto Capitalization

Market picture  The crypto market capitalisation decreased by another 1.5% to $2.27 trillion, getting closer…

5 hours ago

ANF Wave Analysis 29 April 2024

ANF reversed from key support level 113.40 Likely to rise to resistance level 132.31 ANF…

20 hours ago

GBPUSD Wave Analysis 29 April 2024

- GBPUSD rising inside minor correction 2 - Likely to rise to resistance level 1.2700…

20 hours ago

Crypto Market Retreats Due to Overhang of Sellers

Market picture The crypto market has lost 3.3% in the last 24 hours to $2.3…

1 day ago

USDJPY Wave Analysis 26 April 2024

- USDJPY broke key resistance level 155.00 - Likely to rise to resistance level 160.00…

4 days ago

This website uses cookies