Categories: Technical analysis

Gold Wave Analysis – 23 April, 2020

  • Gold reversed from support area
  • Likely to rise to 1746.00

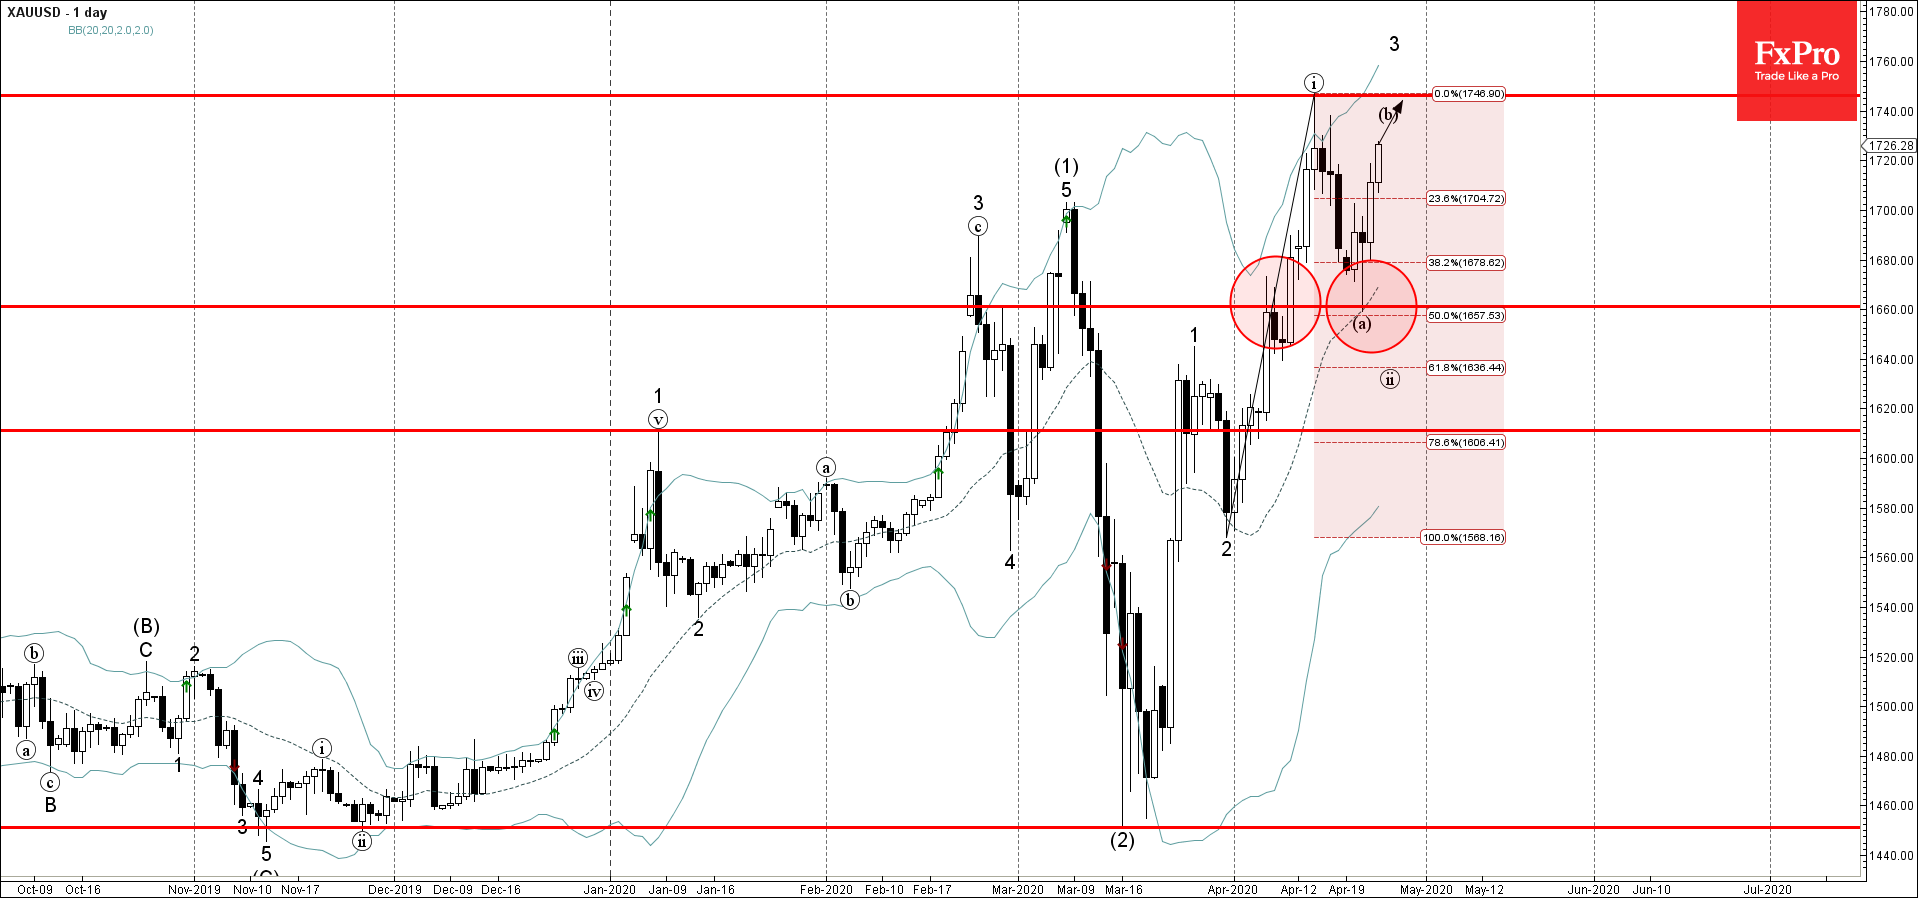
Gold continues to rise after the earlier upward reversal from the support area lying between the pivotal support level 1660.00 and the 50% Fibonacci retracement of the previous upward impulse (i).

The upward reversal from this support area created the daily candlestick reversal pattern Hammer – which started the active wave (b).

Gold is expected to rise further toward the next resistance level 1746.00 (top of the previous impulse wave (i)).


The FxPro Tech Analysis Team

The FxPro technical experts prepare a daily analysis of the most active currency pairs (majors, crosses, exotics) and commodities. Selected instruments are reviewed on daily trends (D1, H4), using the active Elliott Wave setups, Japanese candlesticks, indicators, and support/resistance levels.

Share
Published by
The FxPro Tech Analysis Team
Tags: XAUUSD

Recent Posts

Brent crude oil Wave Analysis 17 May 2024

- Brent crude oil reversed from key support level 81.00 - Likely to test resistance…

19 hours ago

Silver Wave Analysis 17 May 2024

- Silver broke multi-year resistance level 29.50 - Likely to reach resistance level 32.00 Silver…

19 hours ago

The dollar index clings to the uptrend

The US dollar is not giving up without a fight, gaining for the second day…

23 hours ago

After surpassing $30, silver may aim for $50

Silver climbed above $29.8, rewriting the highs from January 2021, but once again faced selling…

1 day ago

The crypto market is ready to grow further

Market picture The crypto market cooled off on Thursday afternoon, but on Friday morning, buyers…

1 day ago

Amazon Wave Analysis 16 May 2024

- Amazon reversed from resistance level 190.00 - Likely to fall to support level 180.00…

2 days ago

This website uses cookies