Categories: Technical analysis

Gold Wave Analysis – 22 November , 2018

  • Gold rising inside short-term ABC correction (ii)
  • Further gains are likely

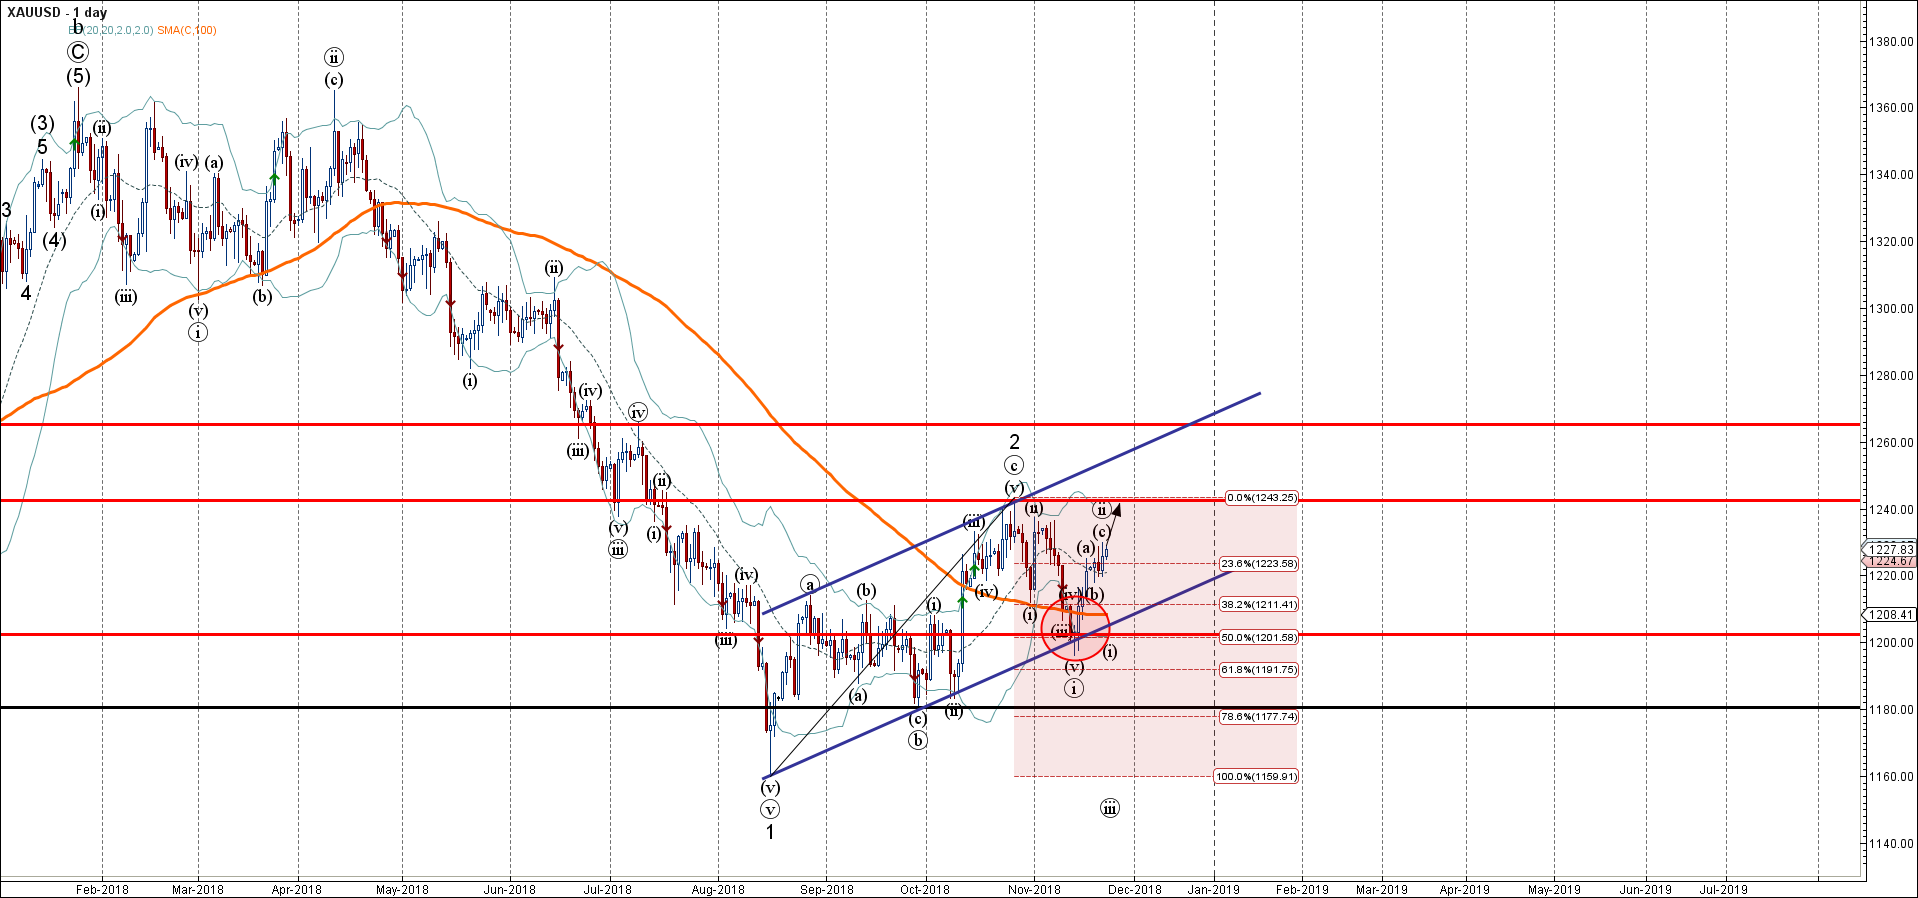
Gold continues to rise inside the short-term ABC correction (ii) – which started earlier from the support area located between the key support level 1200.00, 100-day moving average and the lower daily Bollinger Band.

This support area was further strengthened by the support trendline of the daily up channel from August and the 50% Fibonacci correction of the previous upward correction 2 from August.

Gold is expected to rise further and re-test the next resistance level 1240.00 (monthly high from the end of October).

AddThis Website Tools
The FxPro Tech Analysis Team

The FxPro technical experts prepare a daily analysis of the most active currency pairs (majors, crosses, exotics) and commodities. Selected instruments are reviewed on daily trends (D1, H4), using the active Elliott Wave setups, Japanese candlesticks, indicators, and support/resistance levels.

Share
Published by
The FxPro Tech Analysis Team
Tags: XAUUSD

Recent Posts

NZDUSD Wave Analysis – 19 March 2025

NZDUSD: ⬇️ Sell - NZDUSD reversed from the resistance level 0.5820 - Likely to fall…

57 seconds ago

EURUSD Wave Analysis – 19 March 2025

EURUSD: ⬇️ Sell - EURUSD reversed from resistance level 1.0930 - Likely to fall to…

2 minutes ago

Ethereum gives way

The crypto market remains in a downtrend, with Ethereum losing market share while Bitcoin's share…

5 hours ago

GBPUSD Wave Analysis – 18 March 2025

GBPUSD: ⬆️ Buy - GBPUSD reversed from support zone - Likely to rise to resistance…

18 hours ago

GBPAUD Wave Analysis – 18 March 2025

GBPAUD: ⬆️ Buy - GBPAUD reversed from the support zone - Likely to rise to…

18 hours ago

Solana Wave Analysis – 18 March 2025

Solana: ⬇️ Sell - Solana reversed from the resistance zone - Likely to fall to…

20 hours ago