Categories: Technical analysis

Gold Wave Analysis – 21 October 2025

Gold: ⬇️ Sell

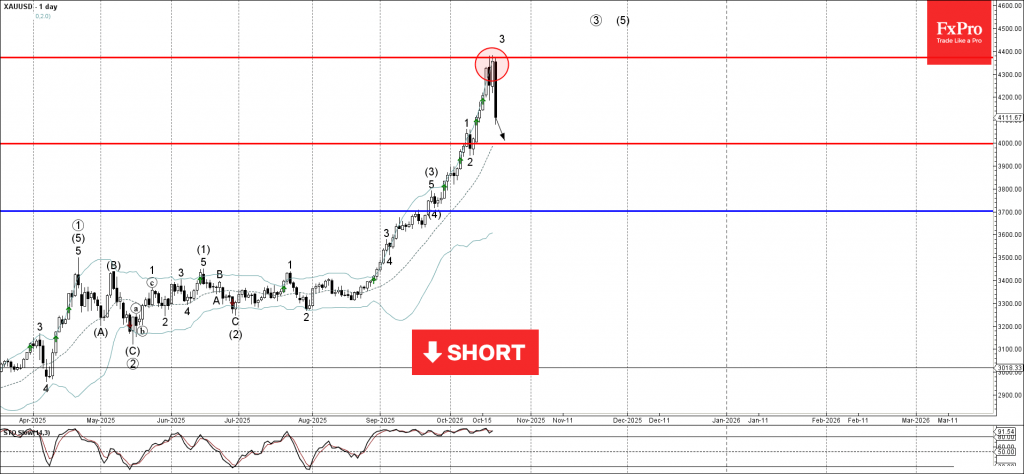
– Gold reversed from key resistance level 4370.00

– Likely to fall to support level 4000.00

Gold falling strongly after the price made 3rd failed attempt to break above the key resistance level 4370.00 standing well above the upper daily Bollinger Band.

The downward reversal from the resistance level 4370.00 will form the daily Japanese candlesticks reversal pattern Bearish Engulfing – strong sell signal for Gold.

Given the abnormally long period of overbought daily Stochastic, Gold can be expected to fall to the next round support level 4000.00.

The FxPro Tech Analysis Team

The FxPro technical experts prepare a daily analysis of the most active currency pairs (majors, crosses, exotics) and commodities. Selected instruments are reviewed on daily trends (D1, H4), using the active Elliott Wave setups, Japanese candlesticks, indicators, and support/resistance levels.

Share
Published by
The FxPro Tech Analysis Team
Tags: gold

Recent Posts

Platinum Wave Analysis – 8 January 2026

Platinum: ⬇️ Sell - Platinum reversed from pivotal resistance level 150.00 - Likely to fall to…

3 hours ago

Baidu Wave Analysis – 8 January 2026

Baidu: ⬇️ Sell - Baidu reversed from resistance zone - Likely to fall to support level…

3 hours ago

EURUSD Wave Analysis – 8 January 2026

EURUSD: ⬇️ Sell - EURUSD broke daily up channel - Likely to fall to support…

5 hours ago

WTI crude oil Wave Analysis – 8 January 2026

WTI crude oil: ⬆️ Buy - WTI crude oil reversed from support zone - Likely…

5 hours ago

Do not underestimate dollar

Positive macro statistics for the US are helping the greenback. Gold could rise to $4,610…

12 hours ago

Crypto fails to find support for a breakout

Crypto markets fell amid caution; Bitcoin and Ethereum face technical and investor shifts, with privacy…

12 hours ago

This website uses cookies