Categories: Technical analysis

Gold Wave Analysis – 21 March, 2019

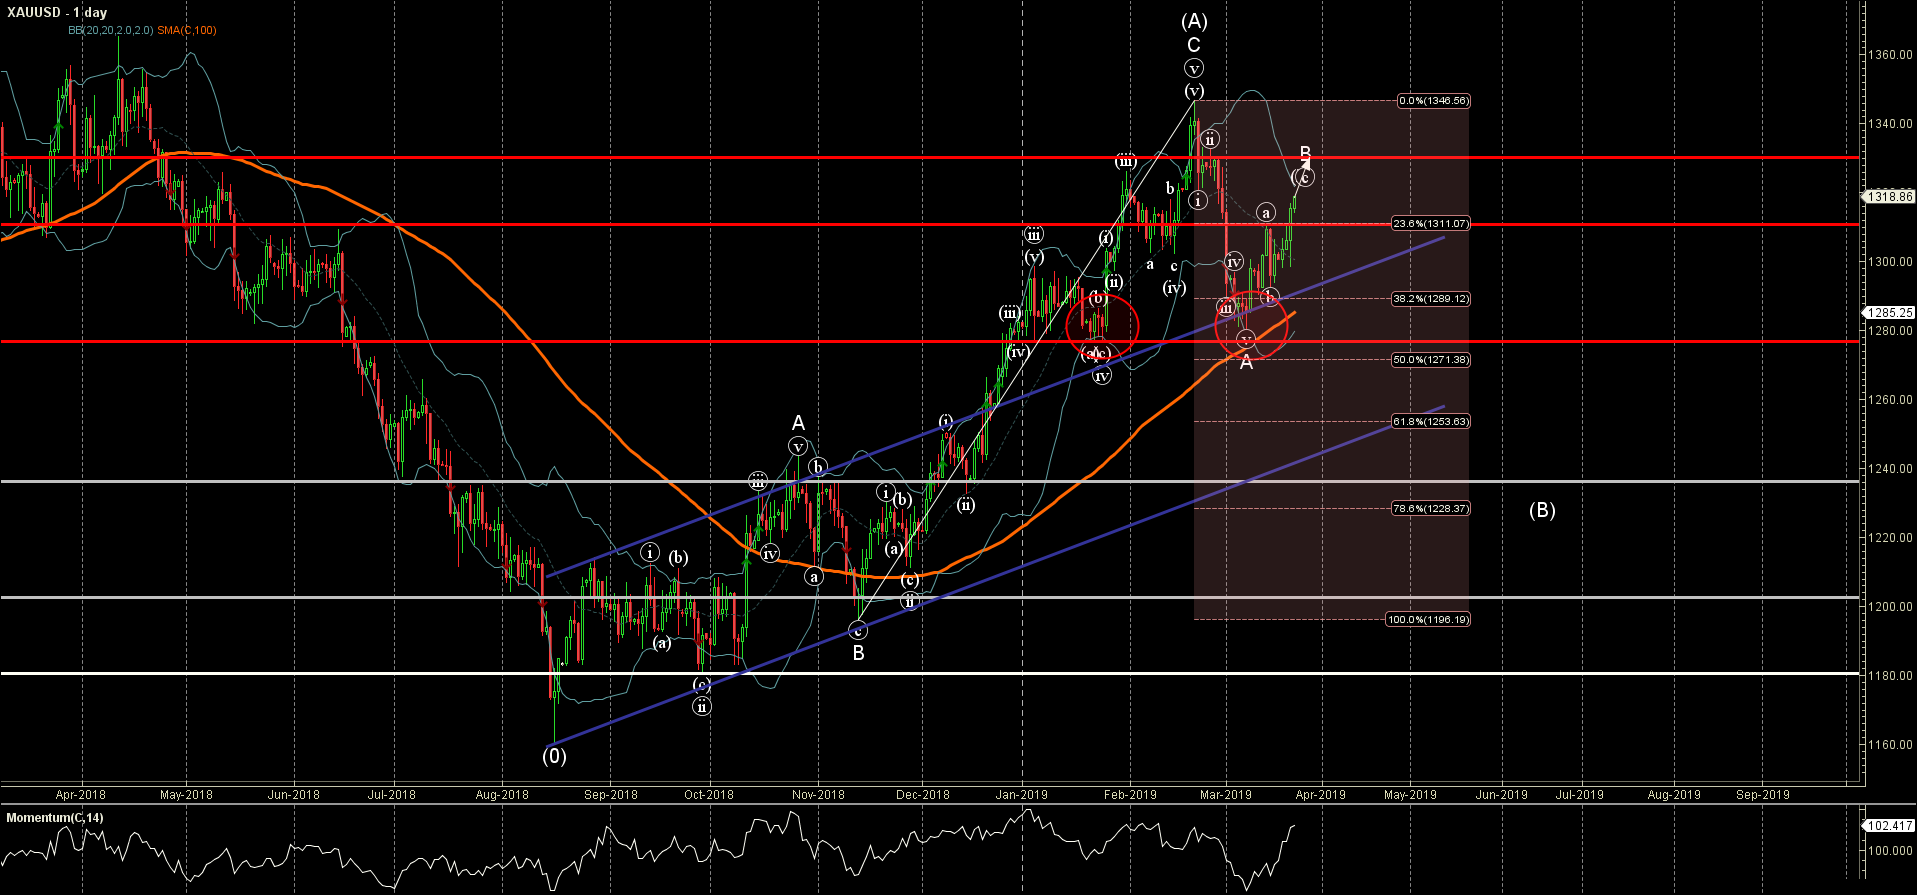
  • Gold broke key resistance level 1310.00
  • Further gains are likely

Gold recently broke through the resistance level 1310.00 (which stopped the (a)-wave of the active B-wave earlier this month).

The breakout of the resistance level 1310.00 strengthened the bullish pressure on Gold – which is apparent from the accelerating daily Momentum indicator.

Gold is expected to rise further and re-test the next resistance level 1330.00 (target price for the completion of the active impulse wave (c)).

AddThis Website Tools
The FxPro Tech Analysis Team

The FxPro technical experts prepare a daily analysis of the most active currency pairs (majors, crosses, exotics) and commodities. Selected instruments are reviewed on daily trends (D1, H4), using the active Elliott Wave setups, Japanese candlesticks, indicators, and support/resistance levels.

Share
Published by
The FxPro Tech Analysis Team
Tags: XAUUSD

Recent Posts

Crypto Market Testing Resistance

The crypto market has increased by over 5% and is nearing the $2.9 trillion. The…

4 hours ago

Gold Wave Analysis – 19 March 2025

Gold: ⬆️ Buy - Gold continues daily uptrend - Likely to rise to resistance level…

18 hours ago

EURJPY Wave Analysis – 19 March 2025

EURJPY: ⬇️ Sell - EURJPY reversed from resistance zone - Likely to fall to support…

18 hours ago

NZDUSD Wave Analysis – 19 March 2025

NZDUSD: ⬇️ Sell - NZDUSD reversed from the resistance level 0.5820 - Likely to fall…

1 day ago

EURUSD Wave Analysis – 19 March 2025

EURUSD: ⬇️ Sell - EURUSD reversed from resistance level 1.0930 - Likely to fall to…

1 day ago

Ethereum gives way

The crypto market remains in a downtrend, with Ethereum losing market share while Bitcoin's share…

1 day ago