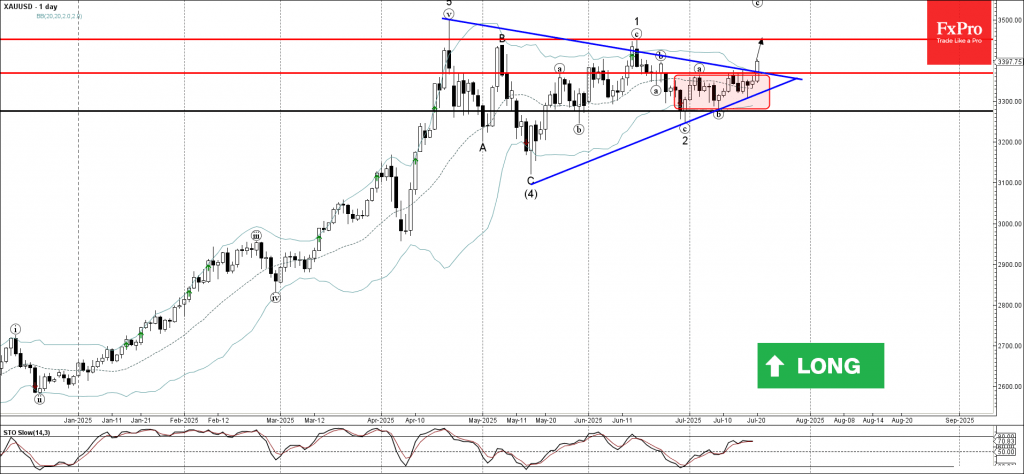
Categories: Technical analysis

Gold Wave Analysis – 21 July 2025

Gold: ⬆️ Buy

– Gold broke resistance daily Triangle

– Likely to rise to resistance level 3450.00

Gold recently broke the resistance zone between the resistance level 3370.00 (upper border of the narrow sideways price range inside which Gold has been trading from the end of June) and the resistance trendline of the daily Triangle from April.

The breakout of this resistance zone accelerated the active impulse wave 3, which is a part of the intermediate impulse wave (5) from May.

Given the clear daily uptrend, Gold can be expected to rise further to the next resistance level 3450.00 (top of the minor impulse wave 1 from the middle of June).

The FxPro Tech Analysis Team

The FxPro technical experts prepare a daily analysis of the most active currency pairs (majors, crosses, exotics) and commodities. Selected instruments are reviewed on daily trends (D1, H4), using the active Elliott Wave setups, Japanese candlesticks, indicators, and support/resistance levels.

Share
Published by
The FxPro Tech Analysis Team
Tags: gold

Recent Posts

CHFJPY Wave Analysis – 9 January 2026

CHFJPY: ⬆️ Buy - CHFJPY reversed from support area - Likely to rise to resistance…

6 hours ago

Exxon Mobil Wave Analysis – 9 January 2026

Exxon Mobil: ⬆️ Buy - Exxon Mobil reversed from support area - Likely to rise…

6 hours ago

Pro News Weekly: Dollar Rebounds as Markets Test New Limits

Welcome to Pro News Weekly! Here’s what is shaping the markets: 💵 The U.S. dollar…

10 hours ago

Geopolitics will destroy the euro

•    EURUSD falls due to geopolitics and expectations of tariff removal •    Gold returns to…

18 hours ago

Platinum Wave Analysis – 8 January 2026

Platinum: ⬇️ Sell - Platinum reversed from pivotal resistance level 150.00 - Likely to fall to…

1 day ago

Baidu Wave Analysis – 8 January 2026

Baidu: ⬇️ Sell - Baidu reversed from resistance zone - Likely to fall to support level…

1 day ago

This website uses cookies