Technical analysis

Gold Wave Analysis – 19 January 2026

Gold: ⬆️ Buy

– Gold reversed from key support level 4547.00

– Likely to rise to resistance level 4800.00

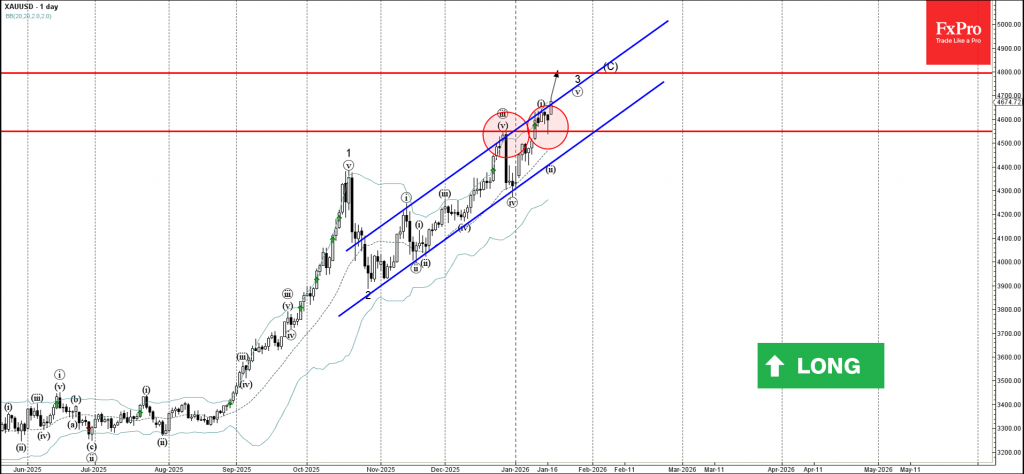
Gold recently reversed up from the key support level 4547.00 (former resistance from the end of December, acting as support after it was broken).

The upward reversal from the support level 4547.00 created the daily Japanese candlesticks Hammer.

Given the strong daily uptrend, Gold can be expected to rise to the next resistance level 4800.00 (target price for the completion of the active impulse wave (C)).

The FxPro Tech Analysis Team

The FxPro technical experts prepare a daily analysis of the most active currency pairs (majors, crosses, exotics) and commodities. Selected instruments are reviewed on daily trends (D1, H4), using the active Elliott Wave setups, Japanese candlesticks, indicators, and support/resistance levels.

Share
Published by
The FxPro Tech Analysis Team
Tags: gold

Recent Posts

Silver Wave Analysis – 19 January 2026

Silver: ⬆️ Buy - Silver broke resistance level 93.30 - Likely to rise to resistance level…

2 hours ago

EUR50 Index Wave Analysis – 19 January 2026

EUR50 Index: ⬇️ Sell - EUR50 Index reversed from resistance area - Likely to fall to…

2 hours ago

EURJPY Wave Analysis – 19 January 2026

EURJPY: ⬆️ Buy - EURJPY reversed from support zone - Likely to rise to resistance level…

2 hours ago

Gold is near its peak

Gold hits historic highs amid tariffs and global tensions; volatility and risk of sharp correction…

11 hours ago

Nat Gas Current situation #tradelikeapro #natgas #naturalgas #tranding #tradingshorts

This is a special gas market review for FX Pro. Today is Monday, January 19th.…

13 hours ago

Trade War Risks Resurface

US-EU trade tensions spark tariffs, impacting economic forecasts, boosting gold prices, and threatening a renewed…

13 hours ago

This website uses cookies