Categories: Technical analysis

Gold Wave Analysis – 19 January, 2022

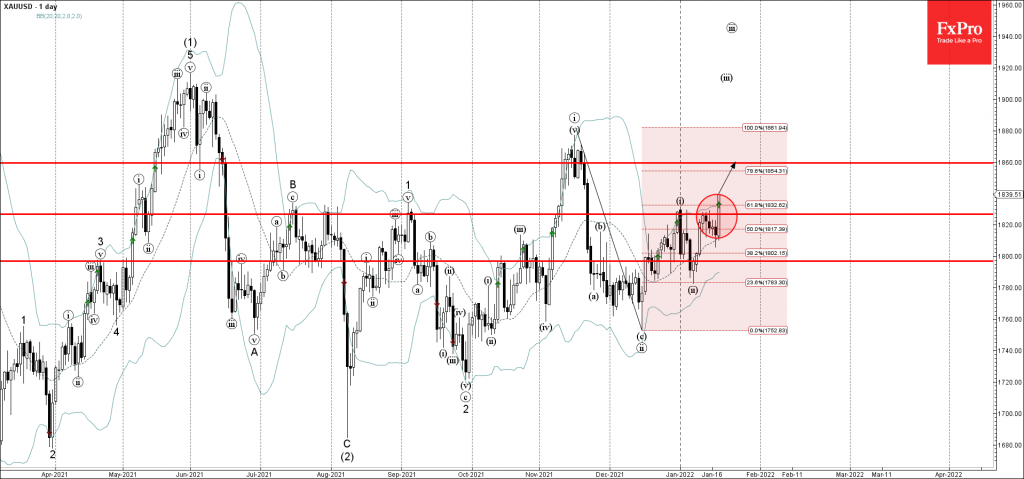
• Gold broke resistance level 1825.00

• Likely to rise to resistance level 1860.00

Gold continues to rise after the earlier breakout of the resistance level 1825.00 (top of the previous impulse wave (i)), intersecting with the 61.8% Fibonacci correction of the earlier downward correction from November.

The breakout of the resistance level 1825.00 continues the active impulse waves (iii) and iii.

Gold can be expected to rise further toward the next resistance level 1860.00 (which has been reversing the pair from the middle of December).

The FxPro Tech Analysis Team

The FxPro technical experts prepare a daily analysis of the most active currency pairs (majors, crosses, exotics) and commodities. Selected instruments are reviewed on daily trends (D1, H4), using the active Elliott Wave setups, Japanese candlesticks, indicators, and support/resistance levels.

Share
Published by
The FxPro Tech Analysis Team
Tags: Gold Price

Recent Posts

EURJPY Wave Analysis 2 May 2024

- EURJPY under strong bearish pressure - Likely to fall to support level 163.10 EURJPY…

3 hours ago

WTI crude oil Wave Analysis 2 May 2024

- WTI broke round support level 80.00 - Likely to fall to support level 76.00…

3 hours ago

ADP hints at another strong NFP on Friday

The monthly ADP labour market report showed that America created 192K new jobs in April, above…

1 day ago

Fed’s hawkish tone risks sinking S&P500 to 4700

Bears showed strength ahead of the FOMC decision.  U.S. indices sagged on Tuesday as investors…

1 day ago

A new stage of Bitcoin’s decline

Market Picture  Bitcoin's closing price on Tuesday became the lowest since late February, confirming the…

2 days ago

Ebay Wave Analysis 30 April 2024

- Ebay under the bearish pressure - Likely to fall to support level 51.00 Ebay…

2 days ago

This website uses cookies