Categories: Technical analysis

Gold Wave Analysis 18 November 2024

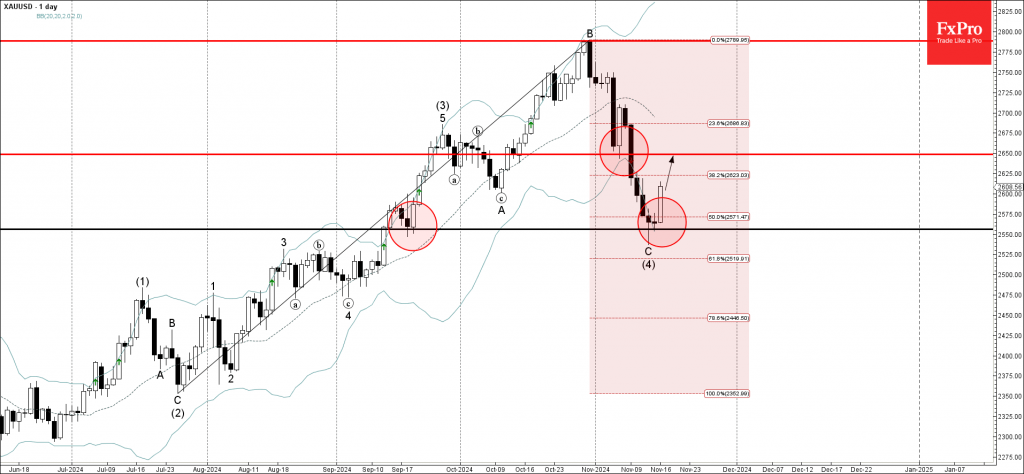
– Gold reversed from key support level 2550.00

– Likely to rise to resistance level 2650.00

Gold recently reversed up from the support zone located between the key support level 2550.00 (which also reversed the price in the middle of September), standing close to the lower daily Bollinger Band and the 50% Fibonacci correction of the upward impulse from July.

The upward reversal from the support level 2550.00 stopped the previous intermediate ABC correction (4) from the end of September.

Given the clear daily uptrend, Gold can be expected to rise to the next resistance level 2650.00 (former support from the start of November).

The FxPro Tech Analysis Team

The FxPro technical experts prepare a daily analysis of the most active currency pairs (majors, crosses, exotics) and commodities. Selected instruments are reviewed on daily trends (D1, H4), using the active Elliott Wave setups, Japanese candlesticks, indicators, and support/resistance levels.

Share
Published by
The FxPro Tech Analysis Team
Tags: gold

Recent Posts

CHFJPY Wave Analysis – 9 January 2026

CHFJPY: ⬆️ Buy - CHFJPY reversed from support area - Likely to rise to resistance…

13 hours ago

Exxon Mobil Wave Analysis – 9 January 2026

Exxon Mobil: ⬆️ Buy - Exxon Mobil reversed from support area - Likely to rise…

13 hours ago

Pro News Weekly: Dollar Rebounds as Markets Test New Limits

Welcome to Pro News Weekly! Here’s what is shaping the markets: 💵 The U.S. dollar…

17 hours ago

Geopolitics will destroy the euro

•    EURUSD falls due to geopolitics and expectations of tariff removal •    Gold returns to…

1 day ago

Platinum Wave Analysis – 8 January 2026

Platinum: ⬇️ Sell - Platinum reversed from pivotal resistance level 150.00 - Likely to fall to…

2 days ago

Baidu Wave Analysis – 8 January 2026

Baidu: ⬇️ Sell - Baidu reversed from resistance zone - Likely to fall to support level…

2 days ago

This website uses cookies