Categories: Technical analysis

Gold Wave Analysis – 17 March 2023


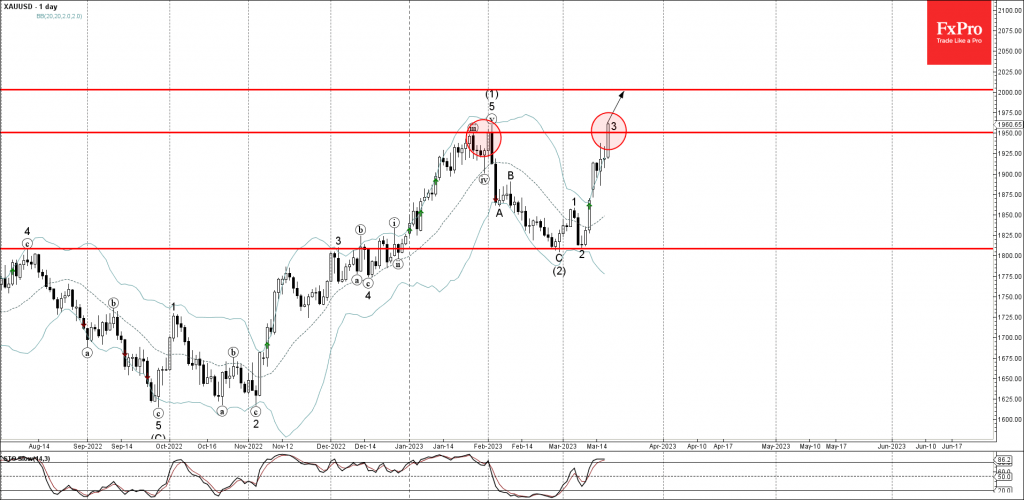
• Gold broke key resistance level 1950.00

• Likely to rise to resistance level 2000.00

Gold just broke above the key resistance level 1950.00 (previous Double Top from the end of January, which stopped the previous waves (iii) and (1)).

The breakout of the resistance level 1950.00 should add to the bullish pressure on Gold -and further accelerate the active impulse waves 3 and (3).

If Gold can close this week above 1950.00, the price can then be expected to rise further toward the next round resistance level 2000.00.

The FxPro Tech Analysis Team

The FxPro technical experts prepare a daily analysis of the most active currency pairs (majors, crosses, exotics) and commodities. Selected instruments are reviewed on daily trends (D1, H4), using the active Elliott Wave setups, Japanese candlesticks, indicators, and support/resistance levels.

Share
Published by
The FxPro Tech Analysis Team
Tags: gold

Recent Posts

S&P 500 Wave Analysis 7 May 2024

- S&P 500 reversed from support level 5000.00 - Likely to rise to resistance level…

4 hours ago

USDCHF Wave Analysis 7 May 2024

- USDCHF reversed from support zone - Likely to rise to resistance level 0.9200 USDCHF…

4 hours ago

EURUSD at the equilibrium, where will it go next?

The single currency is trading near $1.076, waiting for further cues and facing serious resistance…

9 hours ago

Bitcoin can’t accelerate but won’t give up trying

Market picture  The crypto market capitalisation fell by 1.7% in 24 hours to $2.29 trillion,…

14 hours ago

USDJPY Wave Analysis 6 May 2024

- USDJPY reversed from support zone - Likely to rise to resistance level 155.65 USDJPY…

1 day ago

Gold Wave Analysis 6 May 2024

- Gold reversed from support zone - Likely to rise to resistance level 2400.00 Gold…

1 day ago

This website uses cookies