Categories: Technical analysis

Gold Wave Analysis 16 February 2024

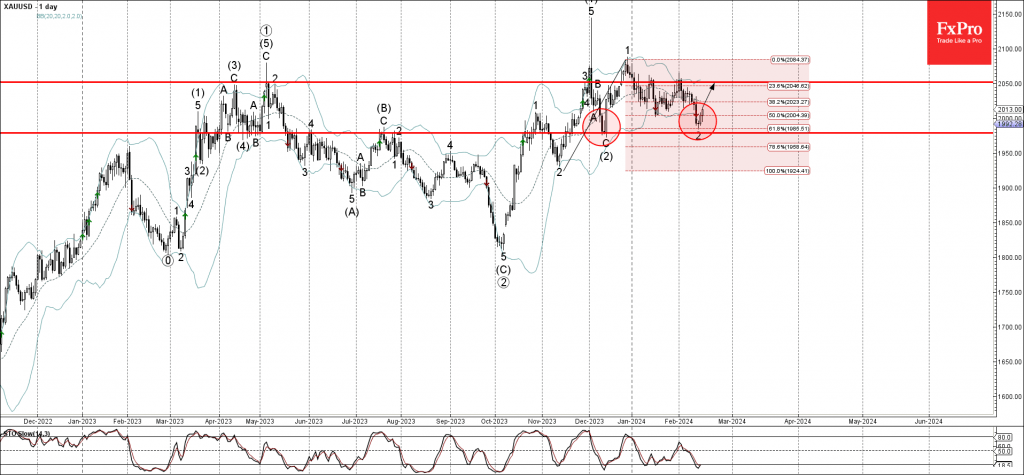
– Gold reversed from support level 1980.00

– Likely to rise to resistance level 2050.00

Gold recently reversed up from the support level 1980.00 (which formed the daily Morning Star in December), intersecting with the lower daily Bollinger Band and the 61.8% Fibonacci correction of the upward impulse from November.

The upward reversal from the support level 1980.00 created the daily Japanese candlestick reversal pattern Doji, which marked the end of the previous minor correction 2.

Given the clear daily uptrend, Gold can be expected to rise further to the next resistance level 2050.00 (which reversed the price twice from January).

The FxPro Tech Analysis Team

The FxPro technical experts prepare a daily analysis of the most active currency pairs (majors, crosses, exotics) and commodities. Selected instruments are reviewed on daily trends (D1, H4), using the active Elliott Wave setups, Japanese candlesticks, indicators, and support/resistance levels.

Share
Published by
The FxPro Tech Analysis Team
Tags: gold

Recent Posts

GBPCHF Wave Analysis 25 June 2024

- GBPCHF reversed from support level 1.1220 - Likely to rise to resistance level 1.1450…

9 hours ago

USDCAD Wave Analysis 25 June 2024

- USDCAD reversed from key support level 1.3620 - Likely to rise to resistance level…

9 hours ago

Nasdaq100 and Nvidia: shakeout, but no reversal yet

Shares of Nvidia, the world's most traded, most popular, and most valuable company, have been…

17 hours ago

Bitcoin’s Attractive Drop

Market Picture The cryptocurrency market was falling to a total capitalisation of $2.2 trillion at…

20 hours ago

Amazon Wave Analysis 24 June 2024

- Amazon reversed from key resistance level 188.50 - Likely to fall to support level…

1 day ago

EURJPY Wave Analysis 24 June 2024

- EURJPY approaching strong resistance level 171.55 - Likely to correct down from 171.55 EURJPY…

1 day ago

This website uses cookies