Categories: Technical analysis

Gold Wave Analysis – 15 May, 2024

• Gold broke daily down channel

• Likely to reach resistance level 2415.00

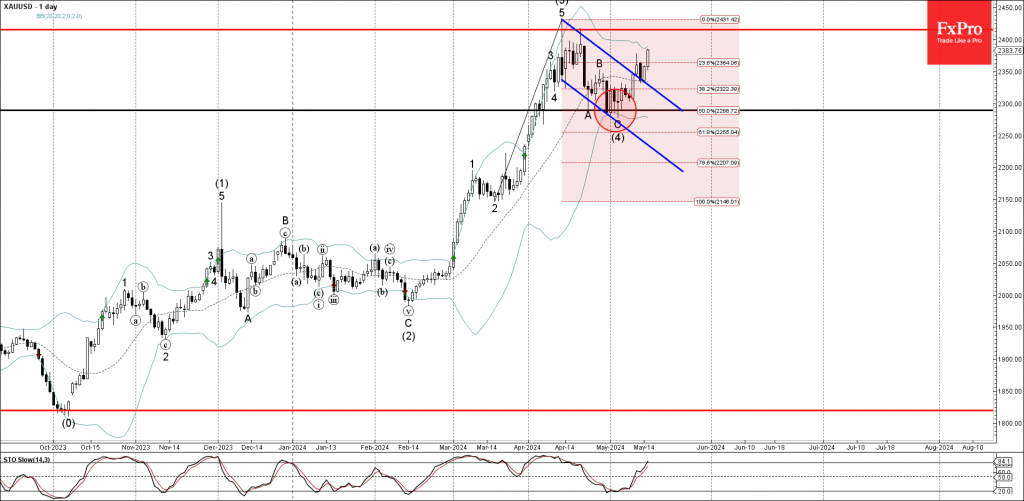
Gold recently broke the resistance trendline of the narrow daily down channel from April, which enclosed the previous ABC correction (4).

The breakout of this down channel accelerated the active intermediate impulse wave (5) – which belongs to the higher order impulse sequence from October.

Given the predominant daily uptrend, Gold can be expected to rise further toward the next resistance level 2415.00, which reversed the price twice in April.

The FxPro Tech Analysis Team

The FxPro technical experts prepare a daily analysis of the most active currency pairs (majors, crosses, exotics) and commodities. Selected instruments are reviewed on daily trends (D1, H4), using the active Elliott Wave setups, Japanese candlesticks, indicators, and support/resistance levels.

Share
Published by
The FxPro Tech Analysis Team
Tags: gold

Recent Posts

EURUSD Wave Analysis – 8 January 2026

EURUSD: ⬇️ Sell - EURUSD broke daily up channel - Likely to fall to support…

29 minutes ago

WTI crude oil Wave Analysis – 8 January 2026

WTI crude oil: ⬆️ Buy - WTI crude oil reversed from support zone - Likely…

34 minutes ago

Do not underestimate dollar

Positive macro statistics for the US are helping the greenback. Gold could rise to $4,610…

8 hours ago

Crypto fails to find support for a breakout

Crypto markets fell amid caution; Bitcoin and Ethereum face technical and investor shifts, with privacy…

8 hours ago

SP500. Current situation #sp500 #tradelikeapro #trading #trandingshorts #tradingstrategy #fxpro

Today is Thursday, January 8th, and we continue talking about the markets. Today, we will…

9 hours ago

NZDCAD Wave Analysis – 7 January 2026

NZDCAD: ⬆️ Buy - NZDCAD reversed from support zone - Likely to rise to resistance…

22 hours ago

This website uses cookies