Categories: Technical analysis

Gold Wave Analysis 15 January 2024

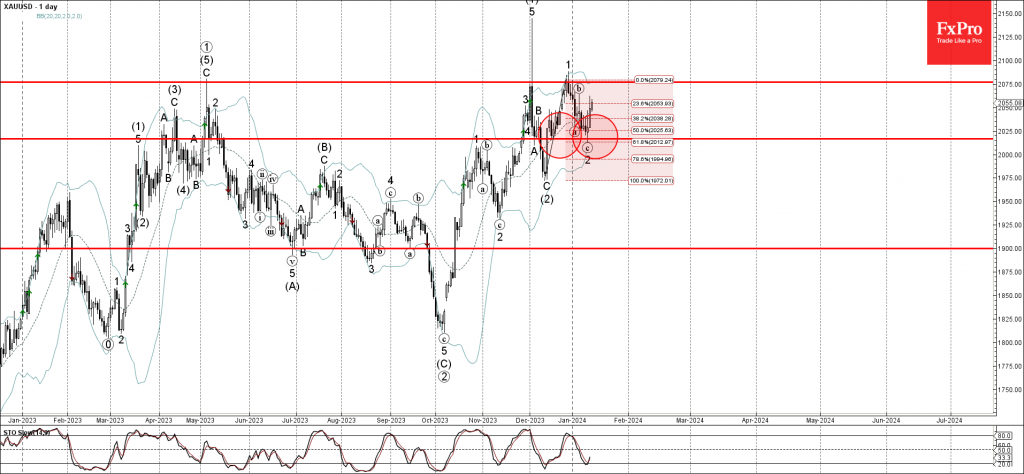
– Gold reversed from support level 2020.00

– Likely to rise to resistance level 2075.00

Gold recently reversed up from the pivotal support level 2020.00 (former minor support from the middle of December).

The support level 2020.00 was strengthened by the lower daily Bollinger Band and by the 61.8% Fibonacci correction of the upward impulse 1 from last month.

Given the clear daily uptrend, Gold can be expected to rise further to the next resistance level 2075.00 (top of the previous minor impulse wave 1).

AddThis Website Tools
The FxPro Tech Analysis Team

The FxPro technical experts prepare a daily analysis of the most active currency pairs (majors, crosses, exotics) and commodities. Selected instruments are reviewed on daily trends (D1, H4), using the active Elliott Wave setups, Japanese candlesticks, indicators, and support/resistance levels.

Share
Published by
The FxPro Tech Analysis Team
Tags: gold

Recent Posts

AMD Wave Analysis – 28 March 2025

AMD: ⬇️ Sell - AMD reversed from pivotal resistance level 115.00 - Likely to fall…

1 day ago

Google Wave Analysis – 28 March 2025

Google: ⬇️ Sell - Google broke key support level 160.00 - Likely to fall to…

1 day ago

Gold Wave Analysis – 28 March 2025

Gold: ⬆️ Buy - Gold broke resistance level 3050.00 - Likely to rise to resistance…

1 day ago

Ethereum Wave Analysis – 28 March 2025

Ethereum: ⬇️ Sell - Ethereum reversed from the resistance level 2120.00 - Likely to fall…

1 day ago

US inflation accelerates but lags income growth

US PCE inflation exceeded expectations at 2.8% in February. Income growth and savings rates remain…

1 day ago

What is next: Australia Rate, EU CPI, US NFP

Europe will switch to daylight saving time next week. Key events include the RBA's rate…

1 day ago