Categories: Technical analysis

Gold Wave Analysis – 14 July, 2022

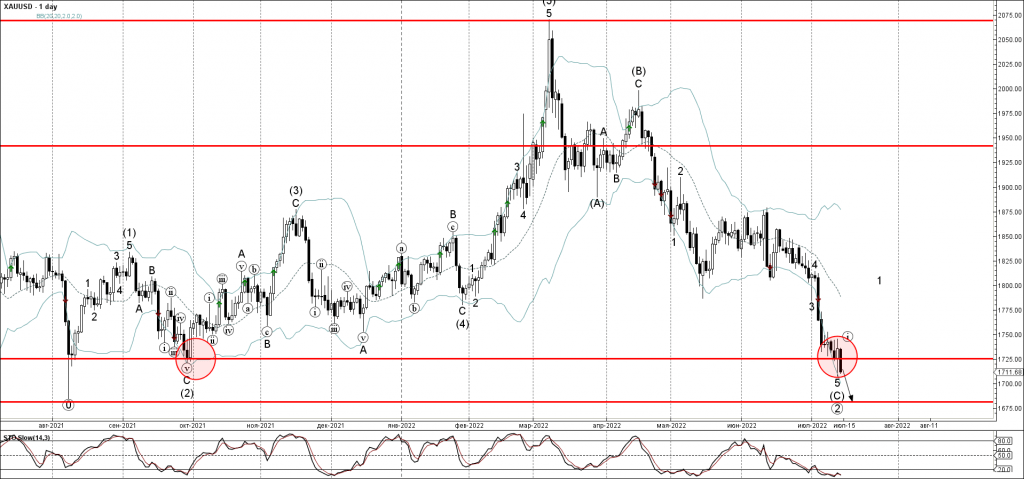
• Gold broke pivotal support level 1725.00

• Likely to fall to support level 1684.00

Gold recently broke below the pivotal support level 1725.00 (former multi-month support from last September).

The breakout of the support level 1725.00 is aligned with the clear downtrend that can be seen on the daily charts.

Gold can be expected to fall further toward the next support level 1684.00 (former powerful support from August of 2021) – from where gold is likely to correct up.

AddThis Website Tools
The FxPro Tech Analysis Team

The FxPro technical experts prepare a daily analysis of the most active currency pairs (majors, crosses, exotics) and commodities. Selected instruments are reviewed on daily trends (D1, H4), using the active Elliott Wave setups, Japanese candlesticks, indicators, and support/resistance levels.

Share
Published by
The FxPro Tech Analysis Team
Tags: gold

Recent Posts

Gold Wave Analysis – 16 April 2025

Gold: ⬆️ Buy - Gold broke resistance zone - Likely to rise to the resistance…

3 hours ago

GBPUSD Wave Analysis – 16 April 2025

GBPUSD: ⬆️ Buy - GBPUSD broke key resistance level 1.3200 - Likely to rise to…

3 hours ago

Platinum Wave Analysis – 15 April 2025

Platinum: ⬆️ Buy - Platinum reversed from support level 905.00 - Likely to rise to…

13 hours ago

USDJPY Wave Analysis – 15 April 2025

USDJPY: ⬆️ Buy - USDJPY reversed from long-term support level 142.00 - Likely to rise…

13 hours ago

FTSE 100 Wave Analysis – 15 April 2025

FTSE 100: ⬆️ Buy - FTSE 100 index broke the resistance zone - Likely to rise…

15 hours ago

EURGBP Wave Analysis – 15 April 2025

EURGBP: ⬇️ Sell - EURGBP reversed from the resistance zone - Likely to fall to support…

15 hours ago