Categories: Technical analysis

Gold Wave Analysis – 13 April 2023

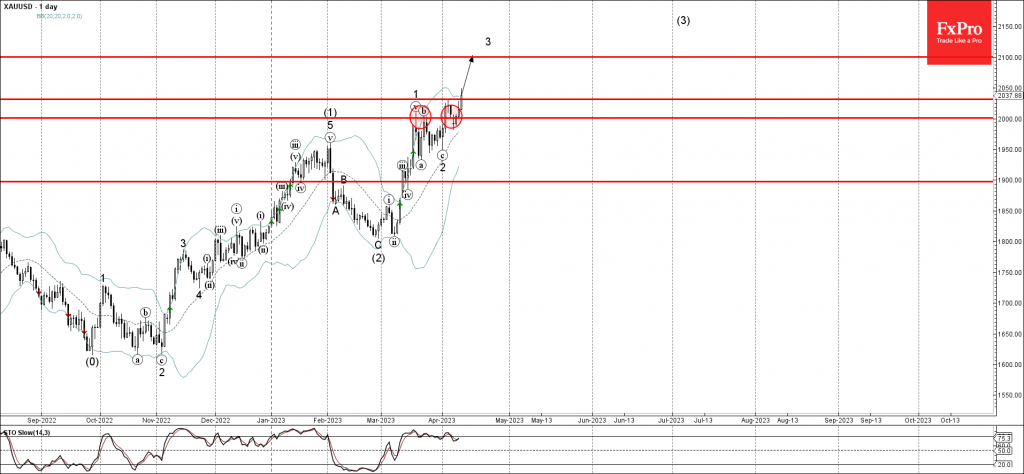
• Gold broke resistance level 2030.00

• Likely to rise to resistance level 2100.

Gold continues to rise after the price broke the minor resistance level 2030.00 (which reversed the price at the start of this month).

The breakout of the resistance level 2030.00 continues the active minor impulse wave 3 which belongs to the sharp upward impulse sequence (3) from February.

Given the multi month uptrend, Gold can then be expected to rise further toward the next resistance level 2100.00 (forecast price for the completion of the active impulse wave 3).

AddThis Website Tools
The FxPro Tech Analysis Team

The FxPro technical experts prepare a daily analysis of the most active currency pairs (majors, crosses, exotics) and commodities. Selected instruments are reviewed on daily trends (D1, H4), using the active Elliott Wave setups, Japanese candlesticks, indicators, and support/resistance levels.

Share
Published by
The FxPro Tech Analysis Team
Tags: gold

Recent Posts

Gold Wave Analysis – 16 April 2025

Gold: ⬆️ Buy - Gold broke resistance zone - Likely to rise to the resistance…

4 hours ago

GBPUSD Wave Analysis – 16 April 2025

GBPUSD: ⬆️ Buy - GBPUSD broke key resistance level 1.3200 - Likely to rise to…

4 hours ago

Platinum Wave Analysis – 15 April 2025

Platinum: ⬆️ Buy - Platinum reversed from support level 905.00 - Likely to rise to…

13 hours ago

USDJPY Wave Analysis – 15 April 2025

USDJPY: ⬆️ Buy - USDJPY reversed from long-term support level 142.00 - Likely to rise…

13 hours ago

FTSE 100 Wave Analysis – 15 April 2025

FTSE 100: ⬆️ Buy - FTSE 100 index broke the resistance zone - Likely to rise…

15 hours ago

EURGBP Wave Analysis – 15 April 2025

EURGBP: ⬇️ Sell - EURGBP reversed from the resistance zone - Likely to fall to support…

15 hours ago