Categories: Technical analysis

Gold Wave Analysis – 12 November , 2018

  • Gold broke support area
  • Further losses are likely

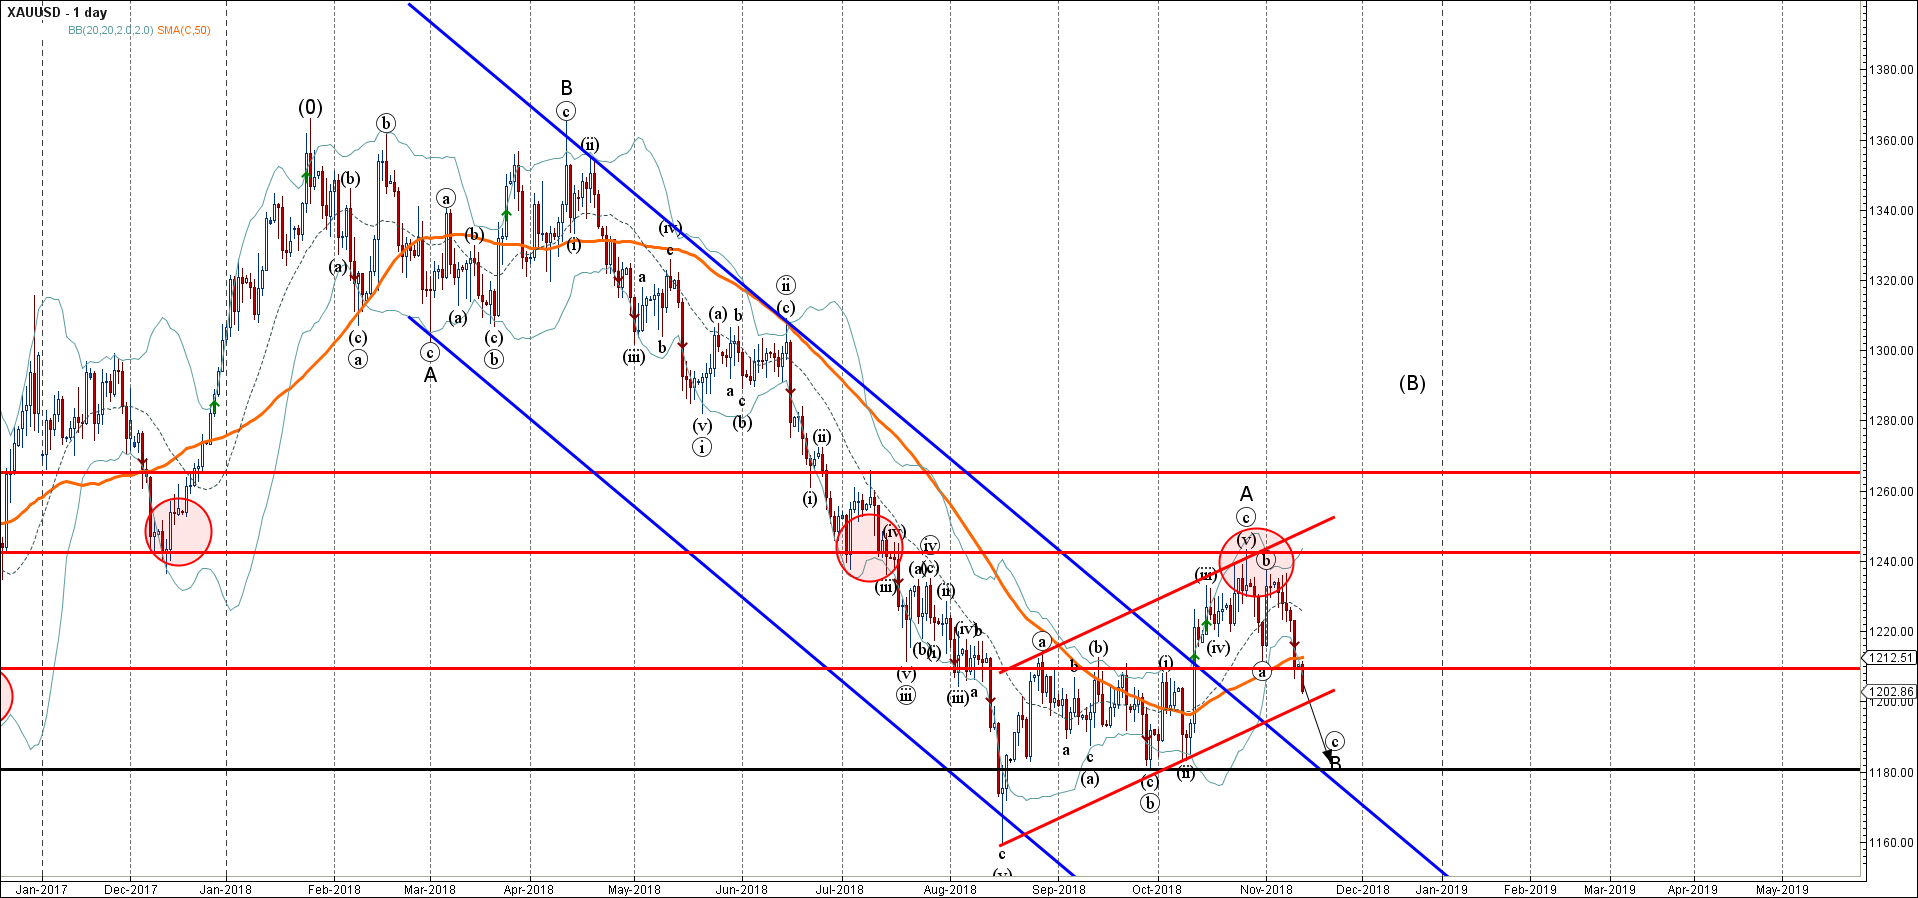
Gold continues to fall after the recent breakout of the combined support area lying at the intersection of the key support level 1210.00 (former major resistance from August and September) and the 50-day moving average.

The breakout of this support area should accelerate the active short-term corrective wave B – which belongs to the medium-term ABC correction (B) from August.

Gold is expected to fall further and re-test the next support level 1180.00 (former support from October and the target price for the completion of the active wave B).

The FxPro Tech Analysis Team

The FxPro technical experts prepare a daily analysis of the most active currency pairs (majors, crosses, exotics) and commodities. Selected instruments are reviewed on daily trends (D1, H4), using the active Elliott Wave setups, Japanese candlesticks, indicators, and support/resistance levels.

Share
Published by
The FxPro Tech Analysis Team
Tags: XAUUSD

Recent Posts

How Low Can the USDJPY Go? 

USDJPY was slipping below 153 on Friday morning, a three-week low and having lost over…

5 hours ago

Bitcoin’s Downtrend, Solana and Ethereum Form Double Bottom

Market picture  Crypto market capitalisation rose 3.3% in 24 hours to $2.22 trillion. Local capitalisation…

11 hours ago

EURJPY Wave Analysis 2 May 2024

- EURJPY under strong bearish pressure - Likely to fall to support level 163.10 EURJPY…

1 day ago

WTI crude oil Wave Analysis 2 May 2024

- WTI broke round support level 80.00 - Likely to fall to support level 76.00…

1 day ago

ADP hints at another strong NFP on Friday

The monthly ADP labour market report showed that America created 192K new jobs in April, above…

2 days ago

Fed’s hawkish tone risks sinking S&P500 to 4700

Bears showed strength ahead of the FOMC decision.  U.S. indices sagged on Tuesday as investors…

2 days ago

This website uses cookies