Categories: Technical analysis

Gold Wave Analysis – 12 December, 2022

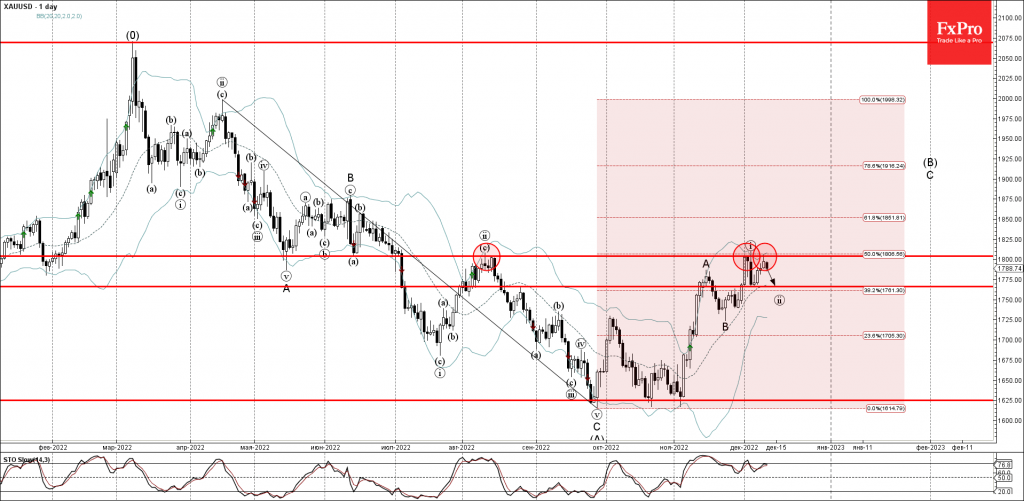
• Gold reversed from key resistance level 1800.00

• Likely to fall to support level 1765.00

Gold previously reversed down from the major resistance level 1800.00 (which has been steadily reversing the price from May, when it served as the strong support).

The resistance level 1800.00 was further strengthened by the intersecting upper daily Bollinger Band and by the 50% Fibonacci correction of the downward impulse from April.

Gold gas can be expected to fall further toward the next support level 1765.00 (low of the earlier Morning Star from the start of December).

The FxPro Tech Analysis Team

The FxPro technical experts prepare a daily analysis of the most active currency pairs (majors, crosses, exotics) and commodities. Selected instruments are reviewed on daily trends (D1, H4), using the active Elliott Wave setups, Japanese candlesticks, indicators, and support/resistance levels.

Share
Published by
The FxPro Tech Analysis Team
Tags: gold

Recent Posts

Brent crude oil Wave Analysis 17 May 2024

- Brent crude oil reversed from key support level 81.00 - Likely to test resistance…

1 day ago

Silver Wave Analysis 17 May 2024

- Silver broke multi-year resistance level 29.50 - Likely to reach resistance level 32.00 Silver…

1 day ago

The dollar index clings to the uptrend

The US dollar is not giving up without a fight, gaining for the second day…

2 days ago

After surpassing $30, silver may aim for $50

Silver climbed above $29.8, rewriting the highs from January 2021, but once again faced selling…

2 days ago

The crypto market is ready to grow further

Market picture The crypto market cooled off on Thursday afternoon, but on Friday morning, buyers…

2 days ago

Amazon Wave Analysis 16 May 2024

- Amazon reversed from resistance level 190.00 - Likely to fall to support level 180.00…

2 days ago

This website uses cookies