Categories: Technical analysis

Gold Wave Analysis – 12 December, 2019

  • Gold reversed from support area
  • Likely to rise to 1500.00

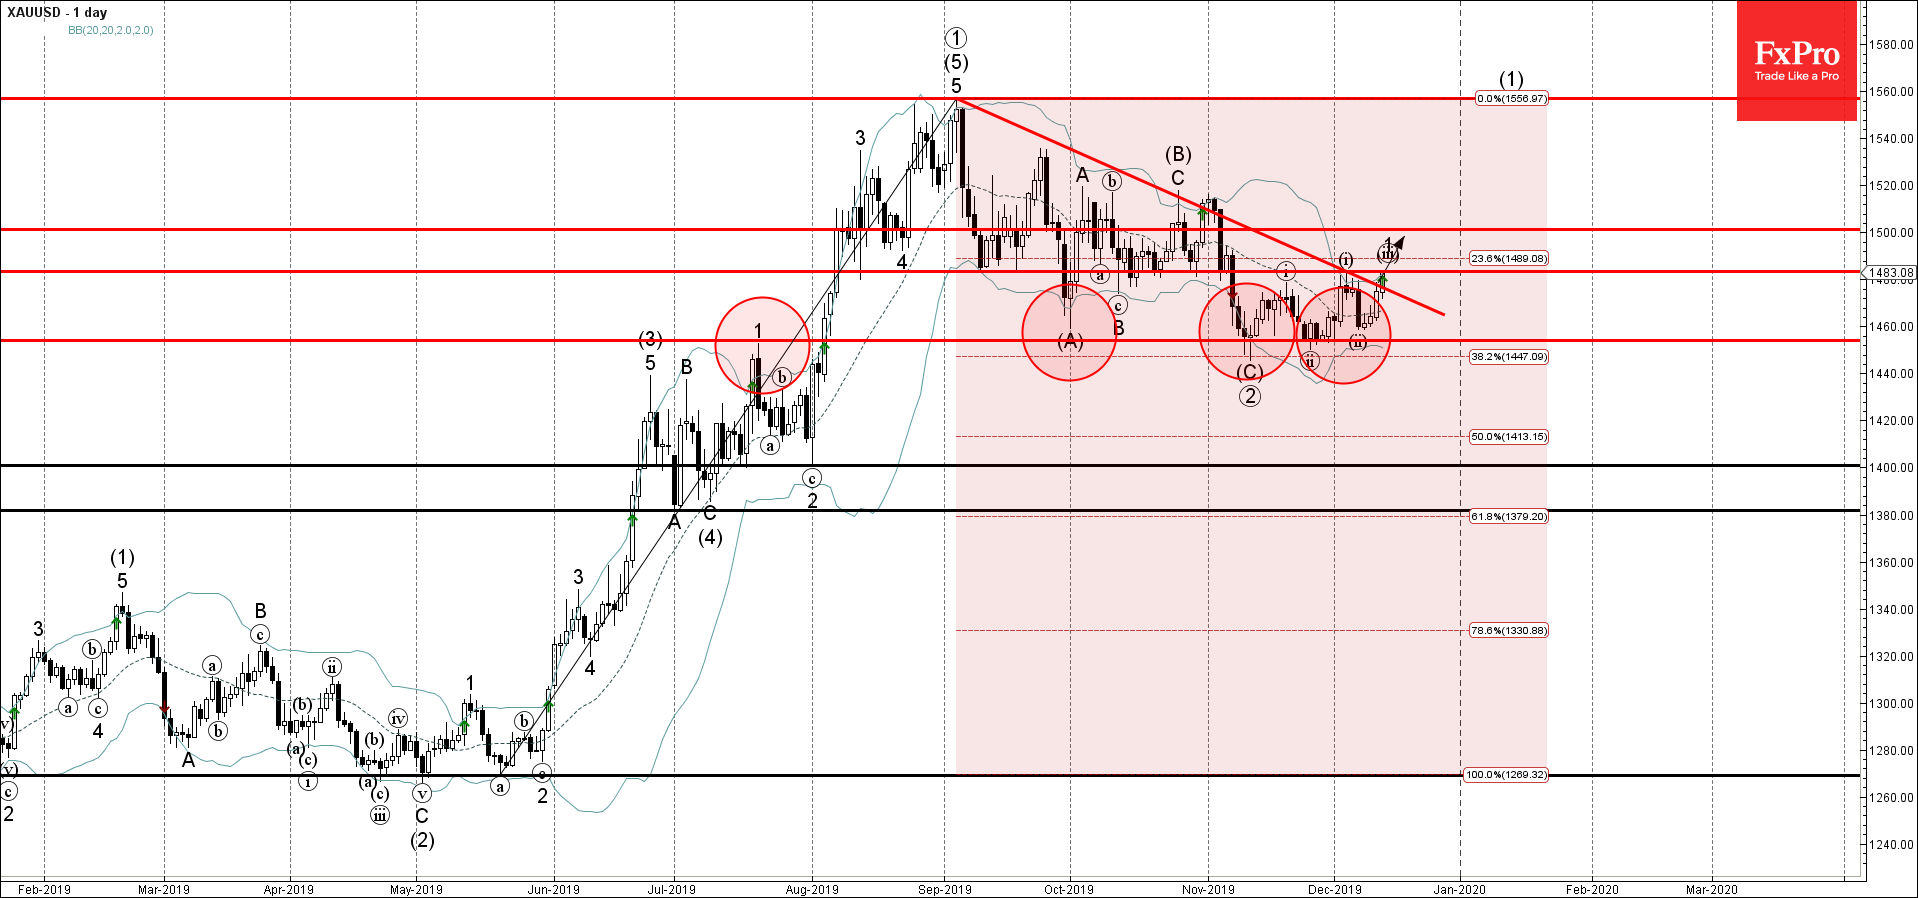
Gold recently reversed up from the support area lying between the support level 1453.00 (which has been reversing the price from September) and the lower daily Bollinger Band.

The price earlier broke the resistance trendline from September – which should accelerate the active impulse waves (i), 1 and (1).

Gold is expected to rise further toward the next round resistance level 1500.00 (target for the completion of the active impulse wave 1).

AddThis Website Tools
The FxPro Tech Analysis Team

The FxPro technical experts prepare a daily analysis of the most active currency pairs (majors, crosses, exotics) and commodities. Selected instruments are reviewed on daily trends (D1, H4), using the active Elliott Wave setups, Japanese candlesticks, indicators, and support/resistance levels.

Share
Published by
The FxPro Tech Analysis Team
Tags: XAUUSD

Recent Posts

AMD Wave Analysis – 28 March 2025

AMD: ⬇️ Sell - AMD reversed from pivotal resistance level 115.00 - Likely to fall…

12 hours ago

Google Wave Analysis – 28 March 2025

Google: ⬇️ Sell - Google broke key support level 160.00 - Likely to fall to…

12 hours ago

Gold Wave Analysis – 28 March 2025

Gold: ⬆️ Buy - Gold broke resistance level 3050.00 - Likely to rise to resistance…

12 hours ago

Ethereum Wave Analysis – 28 March 2025

Ethereum: ⬇️ Sell - Ethereum reversed from the resistance level 2120.00 - Likely to fall…

12 hours ago

US inflation accelerates but lags income growth

US PCE inflation exceeded expectations at 2.8% in February. Income growth and savings rates remain…

17 hours ago

What is next: Australia Rate, EU CPI, US NFP

Europe will switch to daylight saving time next week. Key events include the RBA's rate…

19 hours ago