Categories: Technical analysis

Gold Wave Analysis – 10 November 2025

Gold: ⬆️ Buy

– Gold reversed from support zone

– Likely to rise to resistance level 4200.00

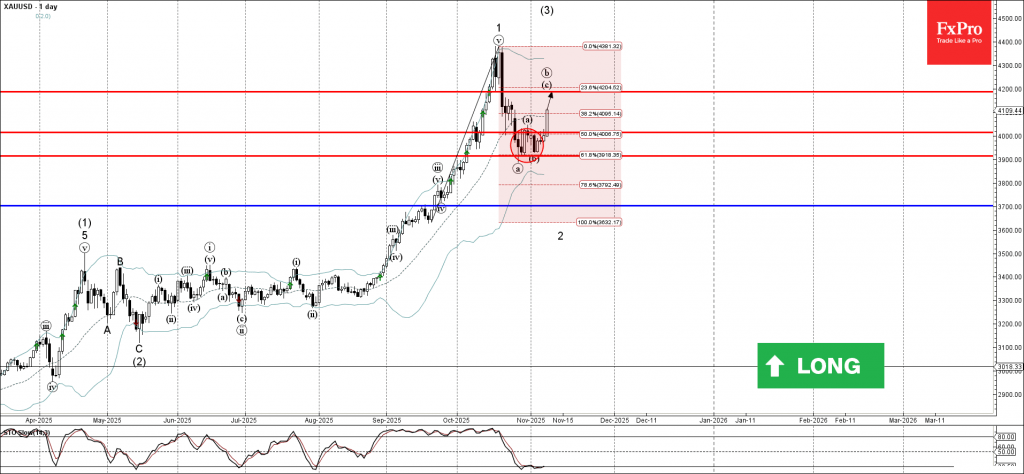
Gold recently reversed up from the support zone between the round support level 4000.00 and the support level 3900.00.

This support zone was strengthened by the lower daily Bollinger Band and by the 61.8% Fibonacci correction of the sharp upward impulse from September.

Given the strong daily trend and the still oversold daily Stochastic, Gold can be expected to rise further to the next resistance level 4200.00 (target price for the completion of the active wave c).

The FxPro Tech Analysis Team

The FxPro technical experts prepare a daily analysis of the most active currency pairs (majors, crosses, exotics) and commodities. Selected instruments are reviewed on daily trends (D1, H4), using the active Elliott Wave setups, Japanese candlesticks, indicators, and support/resistance levels.

Share
Published by
The FxPro Tech Analysis Team
Tags: gold

Recent Posts

Pro News Weekly: Dollar Leads as Stocks Wobble

Welcome to Pro News Weekly! Here’s what is driving the markets this week: 💵 The…

10 hours ago

Strong macro data and rate spreads are the USD’s main weapon

Strong US macro data and wide rate spreads boost the dollar, pressuring EURUSD and gold;…

16 hours ago

Top 10 Forex Trading Strategies

We have outlined the 10 best forex trading strategies with clear logic, real-world context, and…

17 hours ago

Bitcoin has not crossed the correction line

Bitcoin holds near $95.5K as the market steadies but hasn't confirmed a exit from correction…

17 hours ago

CHFJPY Wave Analysis – 15 January 2026

CHFJPY: ⬇️ Sell - CHFJPY reversed from resistance zone - Likely to fall to support level…

1 day ago

WTI Crude Oil Wave Analysis – 15 January 2026

WTI Crude Oil: ⬇️ Sell - WTI Crude Oil rising inside minor impulse wave (1) -…

1 day ago

This website uses cookies