Categories: Technical analysis

Gold Wave Analysis 10 November 2023

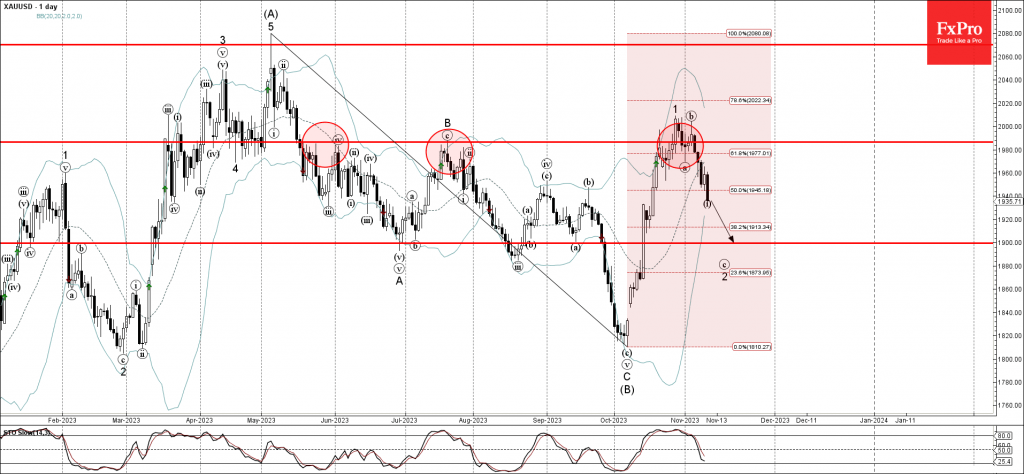
– Gold reversed from resistance level 1985.00

– Likely to fall to support level 1900.00

Gold recently reversed down from the key resistance level 1985.00 (which has been reversing the price from the middle of May) intersecting with the 61.8% Fibonacci correction of the downward impulse from May.

The downward reversal from the resistance level 1985.00 started the earlier short-term ABC correction 2.

Given the strength of the resistance level 1985.00, Gold can be expected to fall further toward the next round support level 1900.00.

The FxPro Tech Analysis Team

The FxPro technical experts prepare a daily analysis of the most active currency pairs (majors, crosses, exotics) and commodities. Selected instruments are reviewed on daily trends (D1, H4), using the active Elliott Wave setups, Japanese candlesticks, indicators, and support/resistance levels.

Share
Published by
The FxPro Tech Analysis Team
Tags: gold

Recent Posts

Weak Chinese data paves the way for lower yuan

Saturday's statistics from China added to fears of a slowdown in the world's second-largest economy,…

5 hours ago

A new local peak in crypto?

Market Picture The crypto market started the weekend on a positive note but has been…

11 hours ago

Fed rate decision: intrigue returns

Influential financial media are promoting the need for a 50-basis point rate cut. The Fed's…

2 days ago

GBPCAD Wave Analysis 13 September 2024

GBPCAD reversed from strong resistance level 1.7850 Likely to fall to support level 1.7700 GBPCAD…

3 days ago

Ebay Wave Analysis 13 September 2024

- Ebay broke resistance level 62.00   - Likely to rise to the resistance level…

3 days ago

Gold broke through the ceiling

After three weeks of consolidation, gold moved decisively upwards, hitting a record above $2572 per…

3 days ago

This website uses cookies