Categories: Technical analysis

Gold Wave Analysis 1 October 2024

– Gold reversed from support level 2625.00

– Likely to rise to resistance level 2685.00

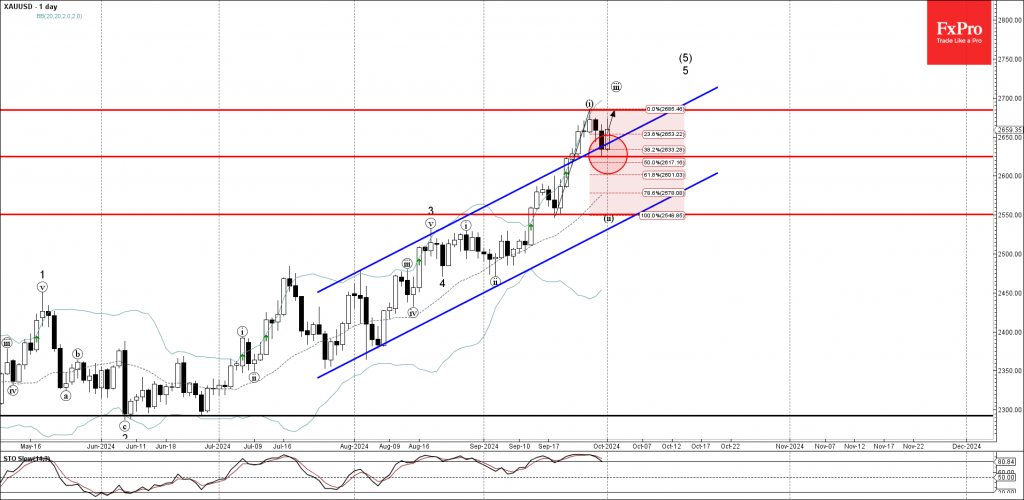
Gold recently reversed up from the support level 2625.00 intersecting with the upper trendline of the daily up channel from July (acting as the support after it was broken in September).

The upward reversal from the support level 2625.00 continues the active short-term impulse wave 5 of the higher order impulse wave (5) from last year.

Given the overriding daily uptrend, Gold can be expected to rise further to the next resistance level 2685.00 (top of the previous impulse wave i).

AddThis Website Tools
The FxPro Tech Analysis Team

The FxPro technical experts prepare a daily analysis of the most active currency pairs (majors, crosses, exotics) and commodities. Selected instruments are reviewed on daily trends (D1, H4), using the active Elliott Wave setups, Japanese candlesticks, indicators, and support/resistance levels.

Share
Published by
The FxPro Tech Analysis Team
Tags: gold

Recent Posts

Video: Dollar and Indices are trying to find footing after the fall

The dollar experienced a sell-off but rallied back up by the end of the week.…

2 days ago

What is next: BoJ, Fed, SNB & BoE Rates

The new week will be packed with economic data and decisions from key central banks.…

2 days ago

Dollar attempts to rebound after oversold conditions

Despite economic factors working against the dollar, its oversold condition helped it this week or…

2 days ago

USDCAD Wave Analysis – 14 March 2025

USDCAD: ⬇️ Sell - USDCAD reversed from key resistance level 1.4500 - Likely to fall…

2 days ago

Solana Wave Analysis – 14 March 2025

Solana: ⬆️ Buy - Solana reversed from the long-term support level 113.75 - Likely to…

2 days ago

Adobe Wave Analysis – 13 March 2025

Adobe: ⬇️ Sell - Adobe broke round support level 400.00 - Likely to fall to…

2 days ago