Categories: Technical analysis

Gold Wave Analysis 1 March 2024

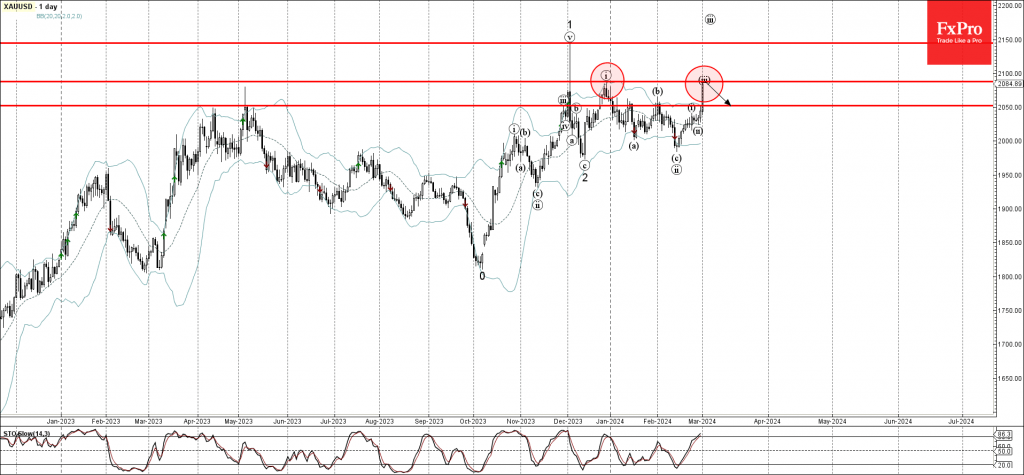
– Gold approached key resistance level 2090.00

– Likely to correct down to support level 2050.00

Gold today rose sharply after the price broke through the key resistance level 2050.00 (which has been reversing the price from the start of January).

The price is currently trading close to the key resistance level 2090.00, former monthly high from last December.

Given the strength of the resistance level 2090.00 and the overbought daily Stochastic, Gold can be expected to all further toward the next support level 2050.00.

The FxPro Tech Analysis Team

The FxPro technical experts prepare a daily analysis of the most active currency pairs (majors, crosses, exotics) and commodities. Selected instruments are reviewed on daily trends (D1, H4), using the active Elliott Wave setups, Japanese candlesticks, indicators, and support/resistance levels.

Share
Published by
The FxPro Tech Analysis Team
Tags: gold

Recent Posts

EURCAD Wave Analysis 6 September 2024

- EURCAD reversed from pivotal support level 1.4900 - Likely to rise to resistance level…

2 days ago

EURUSD Wave Analysis 6 September 2024

- EURUSD reversed from support level 1.1030 - Likely to rise to resistance level 1.1200…

2 days ago

Further Unwinding of Carry Trade

The unwinding of the carry trade in the FX market continues, with the major safe…

2 days ago

Bitcoin pressured by risk-off mood

Market Picture The pressure on risk assets continues, pushing the crypto market capitalisation back below…

2 days ago

AUDUSD Wave Analysis 5 September 2024

- AUDUSD reversed from support level 0.6700 - Likely to rise to resistance level 0.6800…

2 days ago

Gold Wave Analysis 5 September 2024

- Gold reversed from support level 2475.00 - Likely to rise to resistance level 2535.00…

2 days ago

This website uses cookies