Categories: Technical analysis

Gold Wave Analysis 1 March, 2021

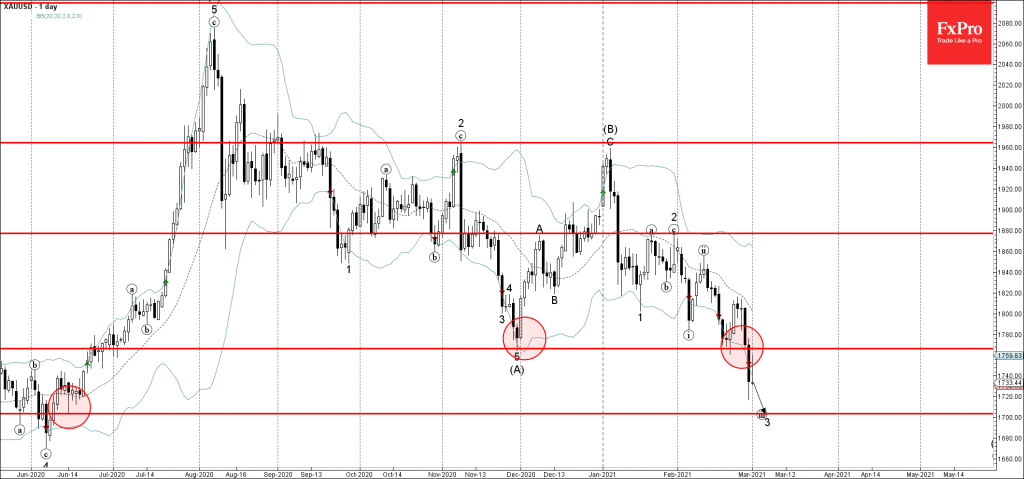
• Gold broke powerful support level 1766.00

• Likely to fall to support level 1700.00

Gold recently broke the powerful support level 1766.00 (which has been reversing the price from the end of  November).

The breakout of the support level 1766.00 was followed by the failed test of this price level (acting as resistance after it was broken) – which is a sell signal for Gold.

Gold is likely to fall further toward the next support level 1700.00 (target price for the completion of the active impulse wave 3, former support from June).

The FxPro Tech Analysis Team

The FxPro technical experts prepare a daily analysis of the most active currency pairs (majors, crosses, exotics) and commodities. Selected instruments are reviewed on daily trends (D1, H4), using the active Elliott Wave setups, Japanese candlesticks, indicators, and support/resistance levels.

Share
Published by
The FxPro Tech Analysis Team
Tags: gold

Recent Posts

Comcast Wave Analysis – 8 December 2025

Comcast: ⬇️ Sell - Comcast reversed from key resistance level 28.00 - Likely to fall…

5 hours ago

Tesla Wave Analysis – 8 December 2025

Tesla: ⬇️ Sell - Tesla reversed from pivotal resistance level 464.00 - Likely to fall…

5 hours ago

Dogecoin Wave Analysis – 8 December 2025

Dogecoin: ⬆️ Buy - Dogecoin reversed from support zone - Likely to rise to resistance…

6 hours ago

USDJPY Wave Analysis – 8 December 2025

USDJPY: ⬆️ Buy - USDJPY reversed from support zone - Likely to rise to resistance…

6 hours ago

Gold. Current situation #tradelikeapro #trading #tradingstrategy #gold #goldprice #tradingshorts

Today is Monday, December 8th, and we will talk about the gold market. Let's take…

13 hours ago

The dollar awaits the rate forecast

The fate of the US dollar depends on capital flows and hawkish rhetoric from the…

17 hours ago

This website uses cookies