Categories: Technical analysis

Gold Wave Analysis 1 August 2024

– Gold reversed from resistance zone

– Likely to fall to support level 2400.00

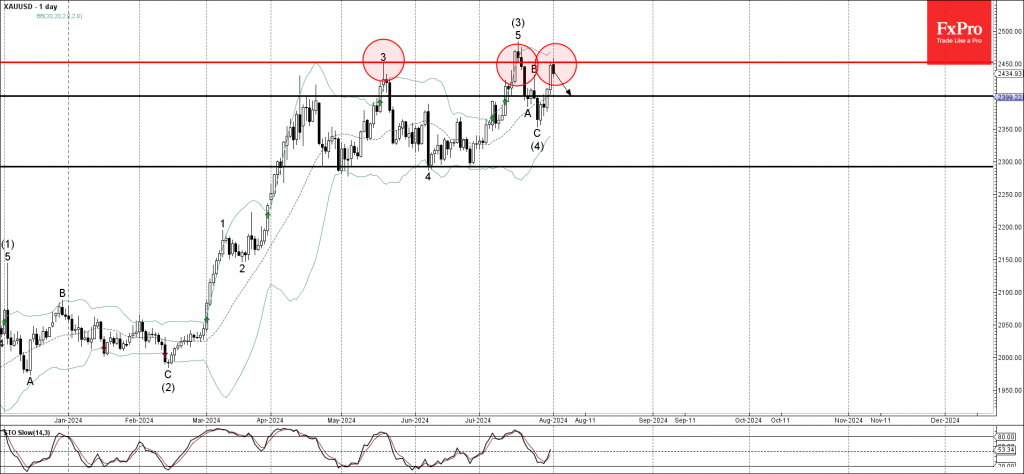
Gold recently reversed down from the resistance zone located between the pivotal resistance level 2450.00 (which has been reversing the price from the middle of May) and the upper daily Bollinger Band.

The downward reversal from this resistance zone stopped the previous intermediate impulse wave (5) from the end of July.

Given the strength of the aforementioned resistance zone, Gold can be expected to fall further toward the next support level 2400.00.

The FxPro Tech Analysis Team

The FxPro technical experts prepare a daily analysis of the most active currency pairs (majors, crosses, exotics) and commodities. Selected instruments are reviewed on daily trends (D1, H4), using the active Elliott Wave setups, Japanese candlesticks, indicators, and support/resistance levels.

Share
Published by
The FxPro Tech Analysis Team
Tags: gold

Recent Posts

Solana Wave Analysis – 5 December 2025

Solana: ⬇️ Sell - Solana reversed from resistance zone - Likely to fall to support…

54 minutes ago

EURAUD Wave Analysis – 5 December 2025

EURAUD : ⬇️ Sell - EURAUD broke the support level 1.7600 - Likely to fall…

55 minutes ago

Forex has set its priorities

In 2026, experts favour the yen, see modest euro growth, and expect pressure on the…

5 hours ago

Bear market rebound in crypto is likely to continue

Crypto rebounds continue; Bitcoin faces resistance, with a mixed market outlook ahead, as regulatory changes…

6 hours ago

Coca-Cola Wave Analysis – 4 December 2025

Coca-Cola: ⬇️ Sell - Coca-Cola reversed from long-term resistance level 73.25 - Likely to fall to…

19 hours ago

DraftKings Wave Analysis – 4 December 2025

DraftKings: ⬆️ Buy - DraftKings reversed from support zone - Likely to rise to resistance level…

19 hours ago

This website uses cookies