- Gold reversed from resistance area
- Likely to fall to 1630.00
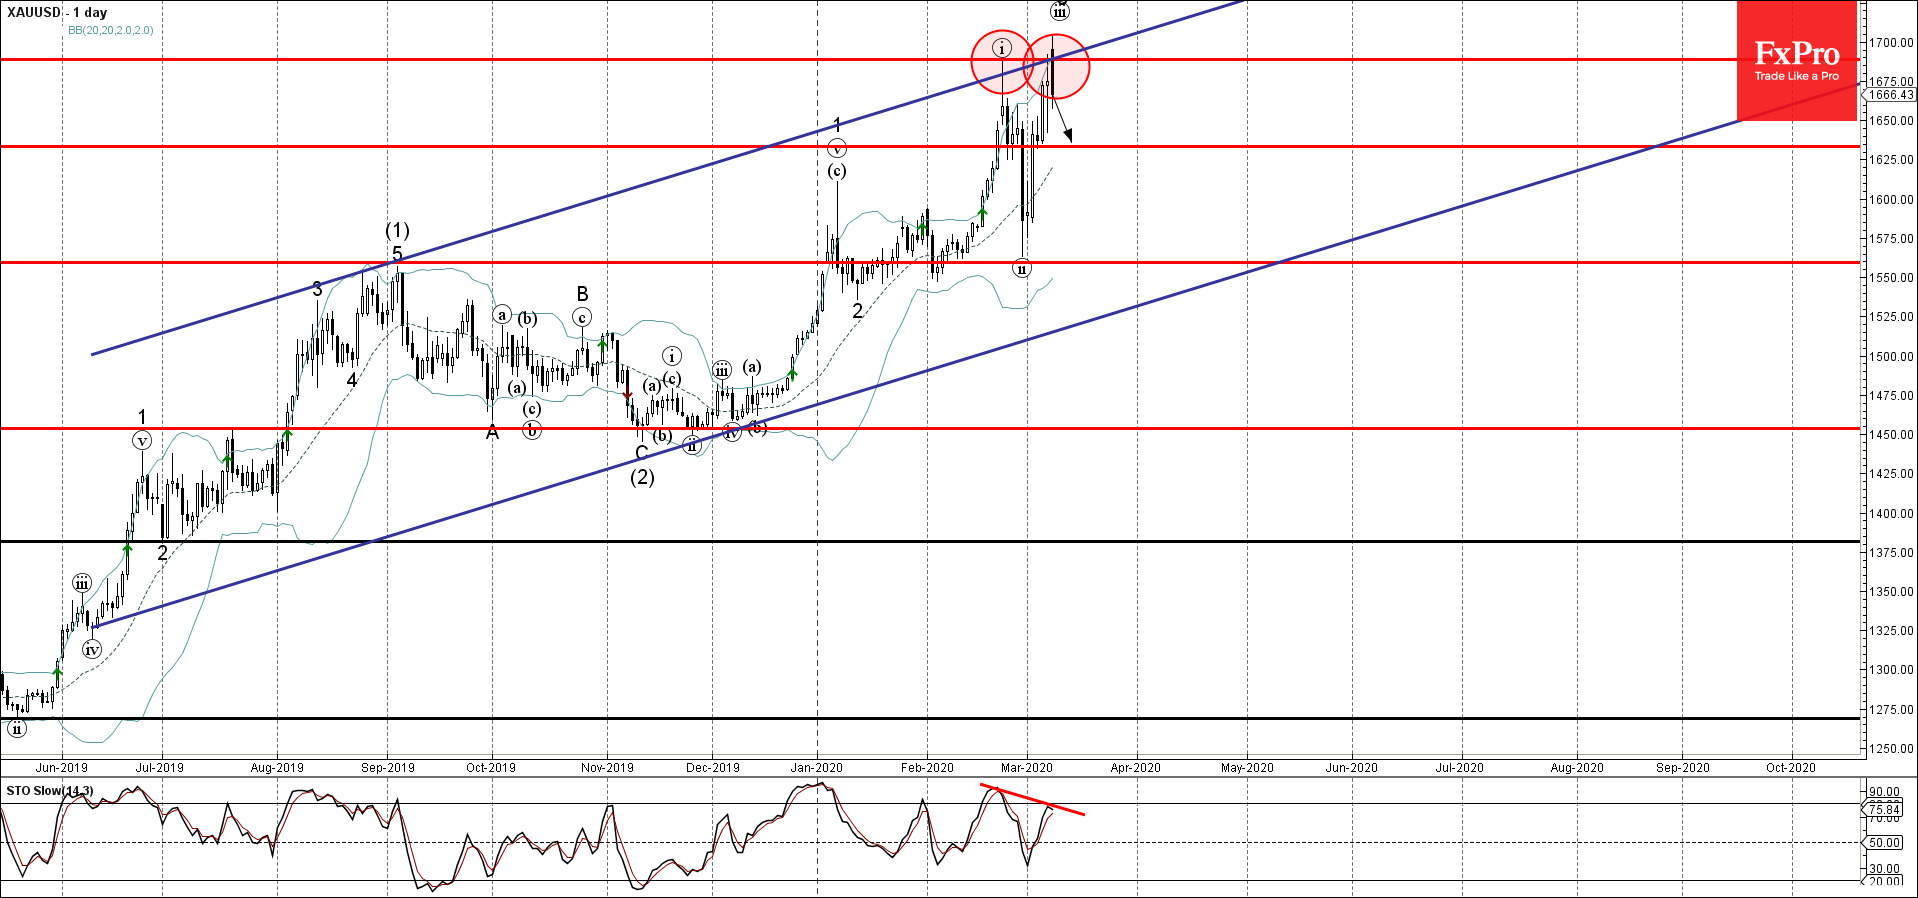
Gold recently reversed down from the resistance area lying between the resistance level 1690.00 (top of the daily Shooting Star from the middle of February), upper daily Bollinger Band and the resistance trendline of the daily up channel from July.
The downward reversal from this resistance area stopped the earlier impulse waves (iii) and 3.
Given the clear bearish divergence on the daily Stochastic indicator – Gold is likely to correct down further toward the next support level 1630.00.