Categories: Technical analysis

Gold Wave Analysis – 07 December , 2018

  • Gold broke key resistance level 1.3390
  • Further gains are likely

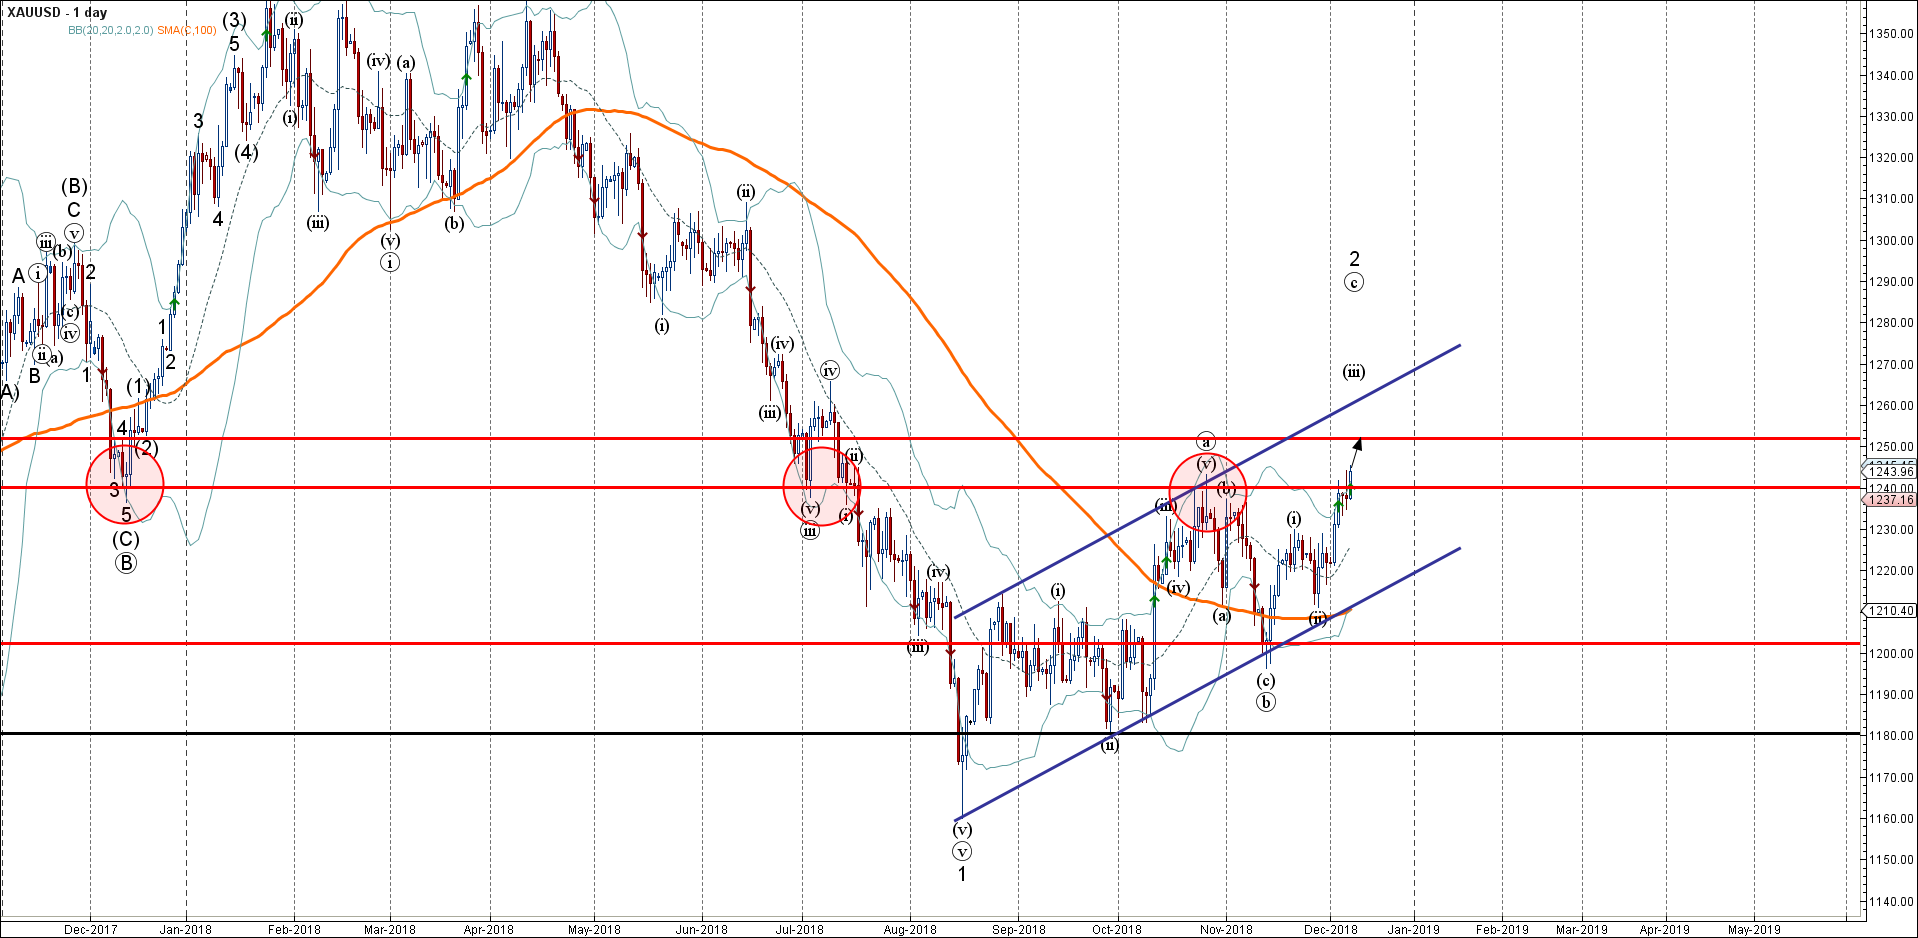
Gold recently broke through the key resistance level 1240.00 (former strong support from December of 2017 and last July, which was mentioned as the likely upward target in our previous forecast for this instrument).

The breakout of the resistance level 1240.00 should accelerate the active short–term impulse wave (c) – which belongs to the medium-term upward ABC correction 2 from the middle of August.

If the price closes this week above 1240.00 – Gold can then be expected to rise further and re-test the next resistance level 1250.00.

The FxPro Tech Analysis Team

The FxPro technical experts prepare a daily analysis of the most active currency pairs (majors, crosses, exotics) and commodities. Selected instruments are reviewed on daily trends (D1, H4), using the active Elliott Wave setups, Japanese candlesticks, indicators, and support/resistance levels.

Share
Published by
The FxPro Tech Analysis Team
Tags: XAUUSD

Recent Posts

ADP hints at another strong NFP on Friday  

The monthly ADP labour market report showed that America created 192K new jobs in April, above…

7 hours ago

Fed’s hawkish tone risks sinking S&P500 to 4700

Bears showed strength ahead of the FOMC decision.  U.S. indices sagged on Tuesday as investors…

11 hours ago

A new stage of Bitcoin’s decline

Market Picture  Bitcoin's closing price on Tuesday became the lowest since late February, confirming the…

14 hours ago

Ebay Wave Analysis 30 April 2024

- Ebay under the bearish pressure - Likely to fall to support level 51.00 Ebay…

1 day ago

GBPAUD Wave Analysis 30 April 2024

- GBPAUD reversed from key support level 1.9135 - Likely to rise to resistance level…

1 day ago

Silver: a possible long road down

Silver has lost 2.6% since the start of the day on Tuesday to $26.4 per…

1 day ago

This website uses cookies